. 2004 Apr;113(7):963-72.
doi: 10.1172/JCI20515.

Hepatic expansion of a virus-specific regulatory CD8(+) T cell population in chronic hepatitis C virus infection

Affiliations

Hepatic expansion of a virus-specific regulatory CD8(+) T cell population in chronic hepatitis C virus infection

Daniele Accapezzato et al. J Clin Invest. 2004 Apr.

Abstract

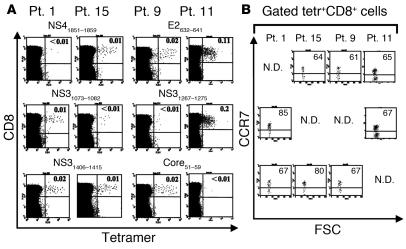
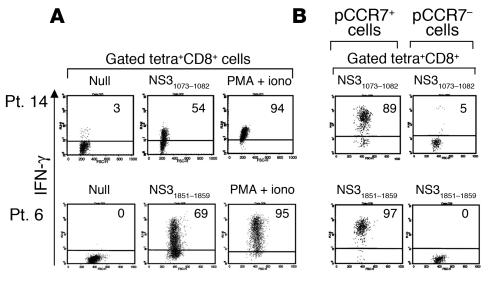
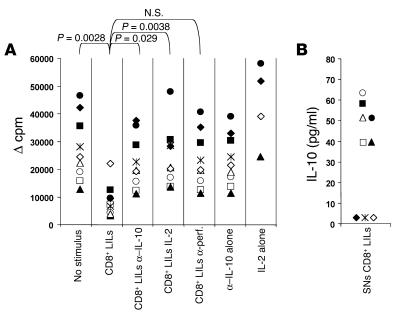
Regulatory T (T(R)) cells consist of phenotypically and functionally distinct CD4(+) and CD8(+) T cell subsets engaged both in maintaining self-tolerance and in preventing anti-non-self effector responses (microbial, tumor, transplant, and so on) that may be harmful to the host. Here we propose that the proinflammatory function of virus-specific memory effector CCR7(-)CD8(+) T cells, which are massively recruited in the liver, are inefficient (in terms of IFN-gamma production) in patients with chronic hepatitis C virus (HCV) infection because of the concomitant presence of virus-specific CCR7(-)CD8(+) T(R) cells producing considerable amounts of IL-10. These CD8(+) T(R) cells are antigen specific, as they can be stimulated by HCV epitopes and suppress T cell responses that are in turn restored by the addition of neutralizing anti-IL-10. This study provides for the first time to our knowledge direct evidence of the existence of virus-specific CD8(+) T(R) cells that infiltrate the livers of patients with chronic HCV infection, identifies IL-10 as a soluble inhibitory factor mediating suppression, and suggests that these cells play a pivotal role in controlling hepatic effector CD8(+) T cell responses.


Figures

Figure 1
Figure 1
Low frequencies of peripheral virus-specific CD8+ T cells expressing a dominant CM (CCR7+) phenotype. PBMCs from two representative HLA-A2+ patients (Pt. 1 and Pt. 15) and two HLA-A3+ patients (Pt. 9 and Pt. 11) were stained first with rat mAb to CCR7 and then with secondary FITC-conjugated goat anti-rat Ig, PE-Cy5–labeled anti-CD8, and the indicated PE-Cy5–labeled tetramers. (A) Dot plot analyses showing CD8+tetramer+ cell percentages. (B) Dot plots, corresponding to those reported in A, are gated on tetramer+CD8+ (Tetr+CD8+) cells, and show CCR7 staining. Results are expressed as percentage of cells, indicated in each quadrant. N.D., not determined; FSC, forward scatter.
Figure 2
Figure 2
Correlations among immunological and clinical parameters. (A) Tetramer+ CD8+CCR7+ cells are significantly more numerous than their CCR7 counterparts in the peripheral (Periph.) blood of patients with chronic HCV infection. Each line represents a single patient. Only tetramer+ populations showing detectable CCR7+ cells have been considered. Statistical analysis was performed by Student’s t test for paired data. (B) Tetramer+CD8+ cells are significantly more numerous in the liver than in the peripheral blood of patients with chronic HCV infection. Each line joining a pair of circles between “Periphery” and “Liver” represents a single patient. Each “Periphery” circle represents the sum of peripheral virus-specific CD8+ T cell frequencies, which were detected by the single tetramers (Table 2). Each “Liver” circle represents the frequencies of virus-specific CD8+ LILs, as detected by the tetramer pool (Table 3). Statistical analysis was performed by Student’s t test for paired data; this included the values less than 0.01% that were arbitrarily considered 0%. (C) Frequencies of tetramer+CD8+ LILs producing IFN-γ are directly correlated with total HAI score. Statistical analysis was performed by the Spearman correlation test. (D) Frequencies of tetramer+CD8+ LILs producing IL-10 are inversely related to total HAI score. Statistical analysis was performed by the Spearman correlation test.
Figure 3
Figure 3
Inefficient effector capacity of peripheral virus-specific CD8+ T cells ex vivo. Representative functional analyses of PBMCs from one HLA-A3+ patient (Pt. 11) and two HLA-A2+ patients (Pt. 6 and Pt. 14) selected for their elevated frequencies of peripheral virus-specific CD8+ T cells, as detected by the indicated tetramers. PBMCs from patients 11 and 6 were previously stained with rat mAb to CCR7, followed by staining with the secondary PE- or FITC-conjugated goat anti-rat Ig, TC-labeled anti-CD8, and the indicated PE-Cy5– or PE-labeled tetramers. Then, cells were stimulated with the relevant peptide and mAb to CD28 or with PMA and ionomycin (iono) and after 6 hours were stained intracellularly with FITC- or PE-labeled anti–IFN-γ. Gated tetramer+CD8+ cells show both single CCR7 staining in forward scatter analysis and double CCR7 and IFN-γ staining. PBMCs from patient 14 were stained with anti-CD8 and tetramers, then stimulated as described above and after 6 hours were stained intracellularly with FITC-labeled anti–IFN-γ or anti–IL-10. Gating analyses were performed at the CD8+ cell level.
Figure 4
Figure 4
Peripheral virus-specific CCR7+ CTLs efficiently differentiate upon antigen-driven proliferation in vitro. (A) PBMCs from HLA-A2+ patients 14 and 6 (Pt. 14 and Pt. 6) (see Table 2) were stimulated with the indicated peptide plus anti-CD28 for 7 days. Then, cells were stained with the corresponding PE-Cy5– or PE-labeled HLA-A2.1+ tetramers and TC- or FITC-labeled mAb to CD8, restimulated or not with peptide and autologous APCs or PMA plus ionomycin for 6 hours, and stained intracellularly with FITC- or PE-Cy5–labeled mAb to IFN-γ. Dot plots are gated on tetramer+CD8+ cells. Results are expressed as percentage of cells. (B) Both peripheral CCR7+ (pCCR7+) and pCCR7 cells purified from PBMCs from both patients were cultured with the relevant peptides and autologous DCs for 7 days. Then, cells were double-stained with the corresponding PE-Cy5–labeled HLA-A2.1+ tetramers and TC- or FITC-labeled mAb to CD8, restimulated for a few hours with peptide and autologous Epstein-Barr virus B cells as APCs, and stained intracellularly with FITC- or PE-labeled mAb to IFN-γ. Dot plots are gated on tetramer+CD8+ cells. Results are expressed as percentage of cells.
Figure 5
Figure 5
Concomitant hepatic expansions of virus-specific CCR7 CTL subsets with inappropriate proinflammatory functions or regulatory phenotypes. (A) Representative tetramer+CD8+ LILs from HLA-A2.1+ patient 2 (see Table 3) expressing the membrane phenotype (CCR7) of effector cells and high perforin levels, but inappropriate IFN-γ production. In particular, LILs from patient 2 were subdivided in two parts. One part was stained intracellularly with TC-labeled mAb to CD8, the pool of PE-labeled HLA-A2.1+ tetramers expressing NS31073–1082, NS31406–1415, or NS41851–1859 (mix tetramer, Mix tetr.), and FITC-labeled anti-perforin. A second part, after being stained with primary rat mAb to CCR7, was stained with the secondary PE-conjugated goat anti-rat Ig and the pool of tetramers indicated above. Then, following stimulation or no stimulation with the corresponding peptides and APCs (autologous irradiated PBMCs) for 6 hours, cells were stained intracellularly with FITC-labeled mAb to IFN-γ. Dot plots are gated on tetramer+ cells. Results are expressed as percentage of cells. Similar results were obtained by studying the other patients tested (see Table 3) with the pool of tetramers indicated for each patient in Table 2. (B) Tetramer+CD8+ LILs isolated from each indicated patient producing poor IFN-γ but notable amounts of IL-10. LILs were stained with the mix tetramer (indicated for each patient in the Table 2), were left unstimulated or were stimulated with the corresponding peptides and autologous APCs for few hours, and were stained intracellularly with both FITC-labeled mAb to IFN-γ or to IL-10. IFN-γ or IL-10 was undetectable in unstimulated cultures in both experiments in A and B (data not shown).
Figure 6
Figure 6
IL-2 drives virus-specific CCR7 cells to terminate the effector cell program. (A and B) Two independent experiments, in which LIL pools derived from two biopsies (for each experiment) of HLA-A2+ patients, were cultured with 50 U/ml IL-2 for 3 days. Then, cells were stained with TC-labeled mAb to CD8, and the pool of PE-labeled HLA-A2.1+ mix tetramer stimulated with the corresponding peptides and autologous PBMCs as APCs for 6 hours, and stained intracellularly with FITC-labeled mAb to IFN-γ. Dot plots are gated on tetramer+CD8+ cells. Results are expressed as percentage of cells. Null, no stimulus. (C) Fresh peripheral (p)CCR7+ and CCR7cells purified from PBMCs of the patients presented in A were cultured with IL-2 as described above and stained with FITC-labeled mAb to CD8 and PE-Cy5–labeled HLA-A2.1+ tetramers expressing NS41851–1859. Then, cells were stimulated with autologous APCs and NS41851–1859 peptide for 6 hours and were stained intracellularly with PE-labeled mAb to IFN-γ. Dot plots are gated on tetramer+CD8+ cells. Results are expressed as percentage of cells.
Figure 7
Figure 7
Hepatic IL-10–producing CD8+ T cells perform a regulatory function. (A) Highly purified CD8+ LILs pooled from two to three biopsies were cocultured with PBMCs plus soluble mAb’s to CD3 and CD28 in the presence or absence of anti–IL-10 (α–IL-10), mAb to perforin (α-perf), or IL-2. Control cocultures were prepared in the presence of either IgG1 or IgG2b isotype, which did not produce any interference with suppressive function (data not shown). Control cultures in which PBMCs were stimulated with mAb’s to CD3 and CD28 in the presence of IL-2 or anti–IL-10 but in the absence of CD8+ LILs were also prepared. Each symbol represents an individual experiment performed with single LIL pool derived from two biopsies. In all experiments, 1 μC [3H]thymidine was added to the cultures after 6 days and the radioactivity incorporated by cells was determined after 18 hours. The cpm values were calculated after subtraction of background (Δ cpm). Statistical analysis was performed by Student’s t test for paired data. (B) The production of IL-10 was determined in the supernatant pool (not conditioned with mAb to IL-10) from cocultures indicated by symbols.
Figure 8
Figure 8
HCV antigens induce regulatory CD8+ T cells. (A–D) Four independent experiments showing that LILs derived from four HLA-A2+ patients suppress HCV-specific proliferation by autologous PBMCs only when stimulated with HCV peptides (HCVLILs) but not when left unstimulated (LILs). In particular, HLA-A2+ PBMCs were cocultured with autologous LILs in the presence or absence of both HLA-A2–related HCV peptides (NS31073–1081, NS31406–1415, and NS41851–1859) and soluble recombinant chimeric NS3/NS4. In some wells, anti–IL-10 Ab was added. (E and F) Two control experiments showing that LILs derived from two HLA-A2+ patients suppress HCV-specific proliferation by autologous PBMCs only when stimulated with HCV peptides (HCVLILs) but not when stimulated with irrelevant HLA-A2–related HIV peptides (pol919–927, nef94–102, and env49–57) (HIVLILs). After 6 days of coculture, 1 μCi [3H]thymidine was added to the cultures and the radioactivity incorporated by cells was determined after 18 hours. The cpm values of PBMCs (in the absence of LILs) in response to NS3/NS4 were calculated after subtraction of background and are indicated in parenthesis. The percent of suppression was calculated with the following formula: (PBMC-LIL coculture cpm / PBMC cpm) × 100.

References

    1. Lauer GM, Walker BD. Hepatitis C virus infection. N. Engl. J. Med. 2001;345:41–52. - PubMed
    1. Cooper S, et al. Analysis of a successful immune response against hepatitis C virus. Immunity. 1999;10:439–449. - PubMed
    1. Prezzi C, et al. Virus-specific CD8+ T cells with type 1 or type 2 cytokine profile are related to different disease activity in chronic hepatitis C virus infection. Eur. J. Immunol. 2001;31:894–906. - PubMed
    1. He XS, et al. Quantitative analysis of hepatitis C virus-specific CD8+ T cells in peripheral blood and liver using peptide-MHC tetramers. Proc. Natl. Acad. Sci. U. S. A. 1999;96:5692–5697. - PMC - PubMed
    1. Lechner F, et al. Analysis of successful immune responses in persons infected with hepatitis C virus. J. Exp. Med. 2000;191:1499–1512. - PMC - PubMed

Publication types