. 2004;5(4):R24.
doi: 10.1186/gb-2004-5-4-r24. Epub 2004 Mar 10.

A transcriptional timetable of autumn senescence

Affiliations

A transcriptional timetable of autumn senescence

Anders Andersson et al. Genome Biol. 2004.

Abstract

Background: We have developed genomic tools to allow the genus Populus (aspens and cottonwoods) to be exploited as a full-featured model for investigating fundamental aspects of tree biology. We have undertaken large-scale expressed sequence tag (EST) sequencing programs and created Populus microarrays with significant gene coverage. One of the important aspects of plant biology that cannot be studied in annual plants is the gene activity involved in the induction of autumn leaf senescence.

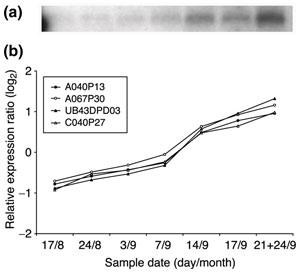
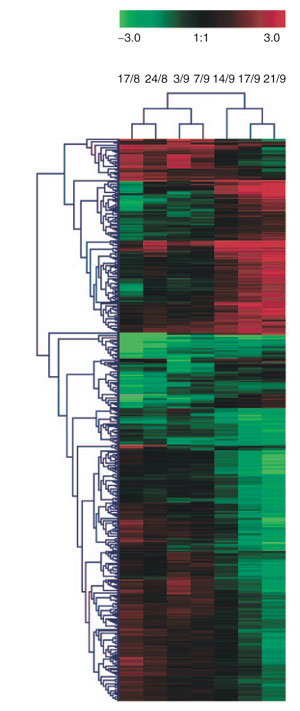
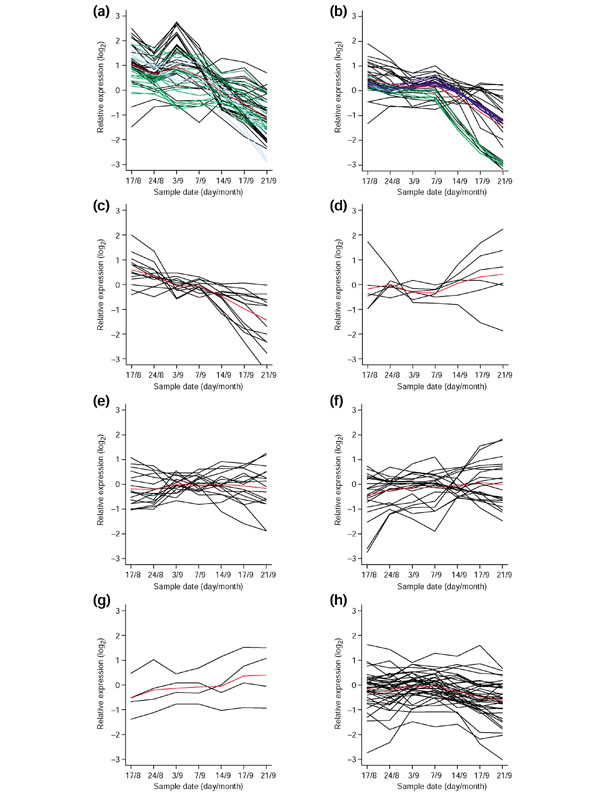
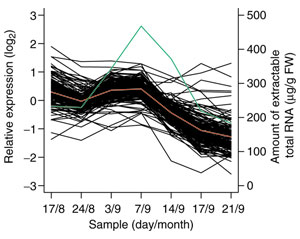
Results: On the basis of 36,354 Populus ESTs, obtained from seven cDNA libraries, we have created a DNA microarray consisting of 13,490 clones, spotted in duplicate. Of these clones, 12,376 (92%) were confirmed by resequencing and all sequences were annotated and functionally classified. Here we have used the microarray to study transcript abundance in leaves of a free-growing aspen tree (Populus tremula) in northern Sweden during natural autumn senescence. Of the 13,490 spotted clones, 3,792 represented genes with significant expression in all leaf samples from the seven studied dates.

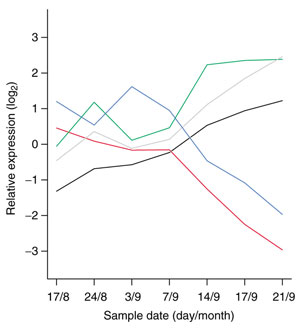
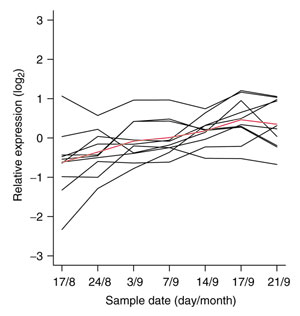
Conclusions: We observed a major shift in gene expression, coinciding with massive chlorophyll degradation, that reflected a shift from photosynthetic competence to energy generation by mitochondrial respiration, oxidation of fatty acids and nutrient mobilization. Autumn senescence had much in common with senescence in annual plants; for example many proteases were induced. We also found evidence for increased transcriptional activity before the appearance of visible signs of senescence, presumably preparing the leaf for degradation of its components.


Figures

Figure 1
Figure 1
Comparison of data for the expression of four different clones of an aspen ubiquitin gene measured by (a) RNA blotting and (b) microarray analysis. The sample date 21/9 corresponds to the microarray analysis and 24/9 to the blotting.
Figure 2
Figure 2
Weather conditions during the sampling period. Gray bars correspond to hours of sunlight per day and black bars to millimeters of precipitation per day. The black line corresponds to the average temperature for each day. The sampling dates are indicated by arrows.
Figure 3
Figure 3
Hierarchical clustering of gene-expression profiles during autumn senescence in aspen. Only genes showing a more than fourfold change in expression level are included. Sample dates are shown as day/month. The values on the color scale are in log2.
Figure 4
Figure 4
The five most abundant types of expression pattern (from k-mean clustering) in aspen leaves during autumn senescence. Mean expression values for each cluster are shown.
Figure 5
Figure 5
Gene expression in functional categories related to energy metabolism in aspen leaves during autumn senescence. Black, green and blue lines show profiles for the individual clones and red lines the averages for the respective categories. (a) Electron-transport proteins of photosynthesis. Blue lines, transcripts in the photosystem I (PSI) reaction center complex subclass; green lines, transcripts in the PSII reaction center complex subclass. (b) Rubisco (rbcS) and Calvin cycle. Blue and green lines, duplicate clones of the two rbcS genes. (c) Photorespiration. (d) Oxidation of fatty acids. (e) Glycolysis and gluconeogenesis. (f) Tricarboxylic acid pathway. (g) Pentose-phosphate pathway. (h) Mitochondrial electron transport and membrane-associated energy conservation.
Figure 6
Figure 6
Protease gene expression in aspen leaves during autumn senescence. (a) Cysteine proteases; (b) chloroplast-located proteases. Black lines show profiles for the individual clones and red lines averages for the respective categories. (c) Other proteases. Black lines, transcripts encoding components of the ubiquitin system; blue lines, transcripts encoding components of the proteasome; green lines, transcripts encoding aspartic proteases; orange lines, transcripts encoding other proteases.
Figure 7
Figure 7
Expression of transcription factors in aspen leaves during senescence. Black lines show profiles for the individual transcripts and the red line indicates the average for the category.
Figure 8
Figure 8
Expression of metallothionein genes (PMt) in aspen leaves during autumn senescence.
Figure 9
Figure 9
Paul (Populus autumn leaf) gene expression in aspen leaves during senescence. Sampling dates are indicated at the bottom and log2 ratios for expression to the left. Black lines show profiles for the individual transcripts and the red line shows average for the category.
Figure 10
Figure 10
Ribosomal protein gene expression in aspen leaves during autumn senescence. Black lines show profiles for the individual transcripts and the red line the average for the category. The green line represents the amount of RNA that was extractable from the leaves [3] in micrograms per gram of fresh weight (FW) (scale on right).
Figure 11
Figure 11
Expression profiles in aspen leaves during senescence of genes that were highly expressed in mature wood. Black lines show profiles for the individual transcripts and the red line the average for the category.

References

    1. The virtual library of plant-arrays: Publications http://www.univ-montp2.fr/~plant_arrays/Plant-Arrays_Publications.html
    1. Sterky F, Regan S, Karlsson J, Hertzberg M, Rohde A, Holmberg A, Amini B, Bhalerao R, Larsson M, Villarroel R, et al. Gene discovery in the wood-forming tissues of poplar: analysis of 5,692 expressed sequence tags. Proc Natl Acad Sci USA. 1998;95:13330–13335. doi: 10.1073/pnas.95.22.13330. - DOI - PMC - PubMed
    1. Bhalerao R, Keskitalo J, Sterky F, Erlandsson R, Bjorkbacka H, Birve SJ, Karlsson J, Gardestrom P, Gustafsson P, Lundeberg J, Jansson S. Gene expression in autumn leaves. Plant Physiol. 2003;131:430–442. doi: 10.1104/pp.012732. - DOI - PMC - PubMed
    1. Hertzberg M, Aspeborg H, Schrader J, Andersson A, Erlandsson R, Blomqvist K, Bhalerao R, Uhlen M, Teeri TT, Lundeberg J, et al. A transcriptional roadmap to wood formation. Proc Natl Acad Sci USA. 2001;98:14732–14737. doi: 10.1073/pnas.261293398. - DOI - PMC - PubMed
    1. Olsen JE, Junttila O. Far red end-of-day treatment restores wild type-like plant length in hybrid aspen overexpressing phytochrome A. Physiol Plant. 2002;115:448–457. doi: 10.1034/j.1399-3054.2002.1150315.x. - DOI - PubMed

Publication types