. 2004;5(4):R25.
doi: 10.1186/gb-2004-5-4-r25. Epub 2004 Mar 15.

The regulatory content of intergenic DNA shapes genome architecture

Affiliations

The regulatory content of intergenic DNA shapes genome architecture

Craig E Nelson et al. Genome Biol. 2004.

Abstract

Background: Factors affecting the organization and spacing of functionally unrelated genes in metazoan genomes are not well understood. Because of the vast size of a typical metazoan genome compared to known regulatory and protein-coding regions, functional DNA is generally considered to have a negligible impact on gene spacing and genome organization. In particular, it has been impossible to estimate the global impact, if any, of regulatory elements on genome architecture.

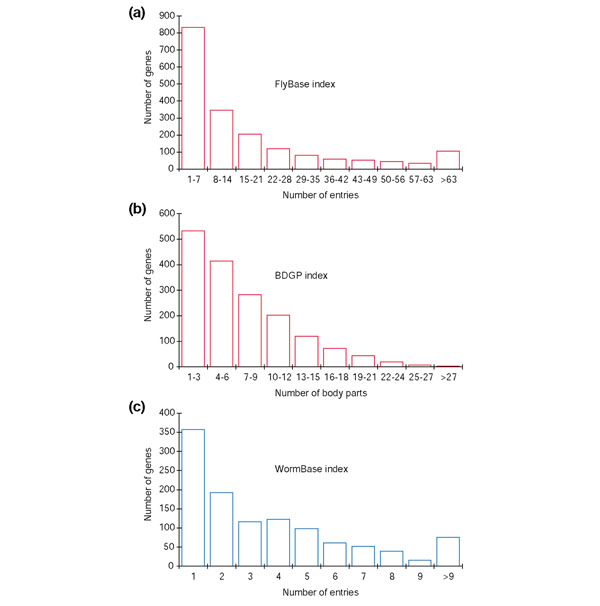
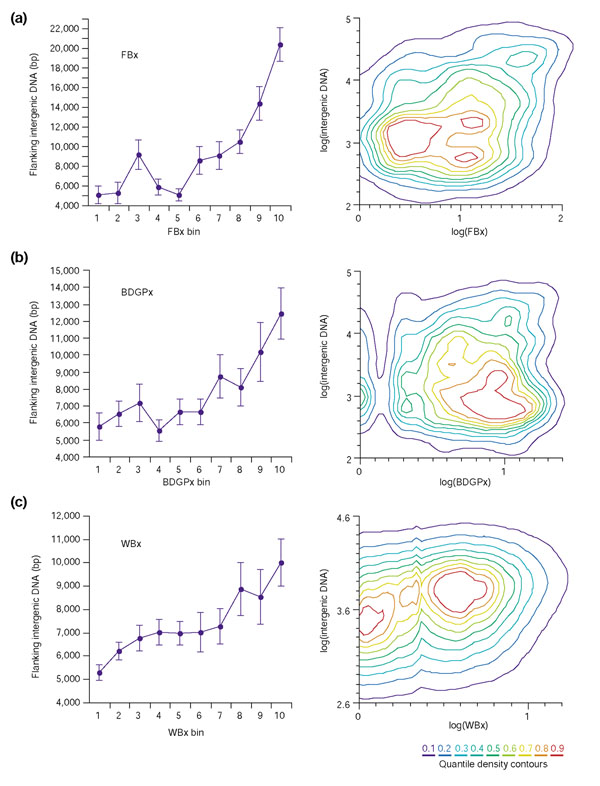
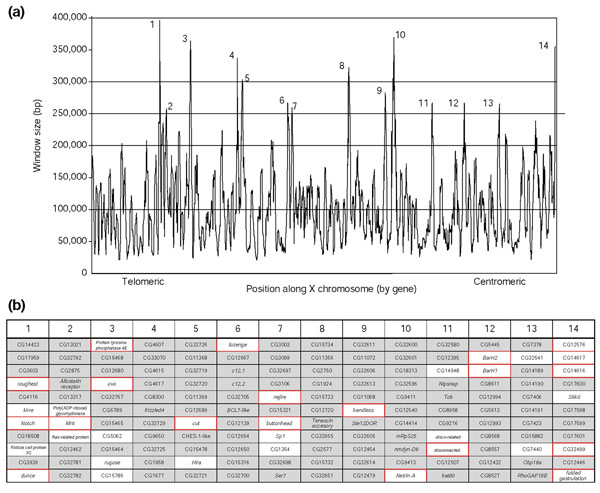
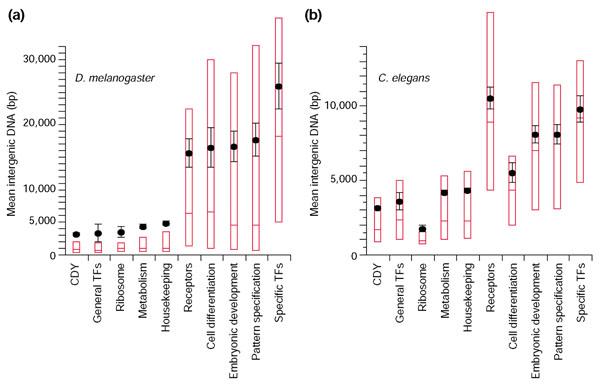
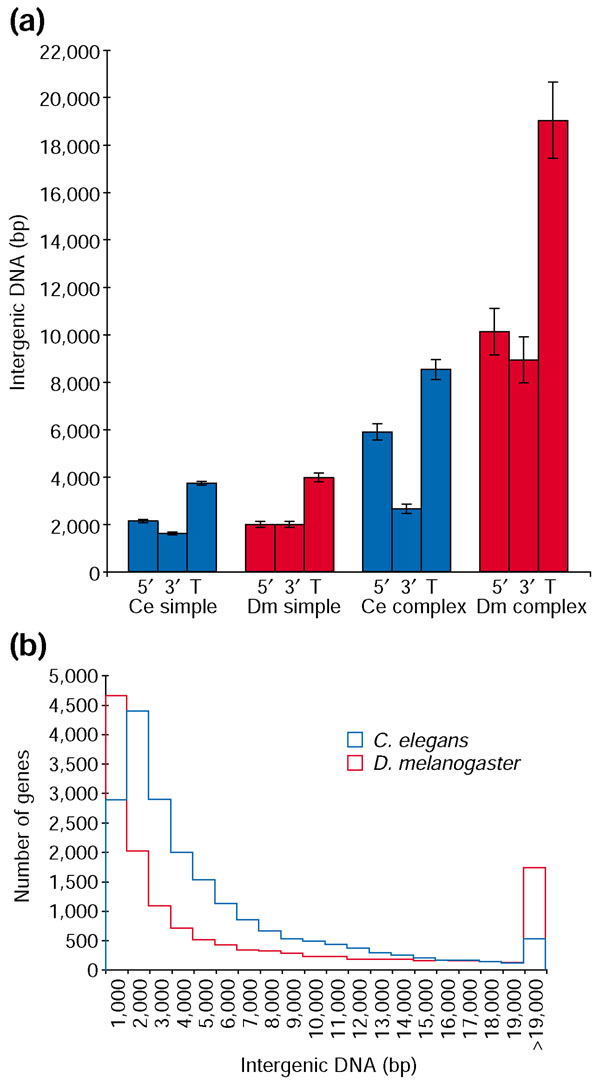
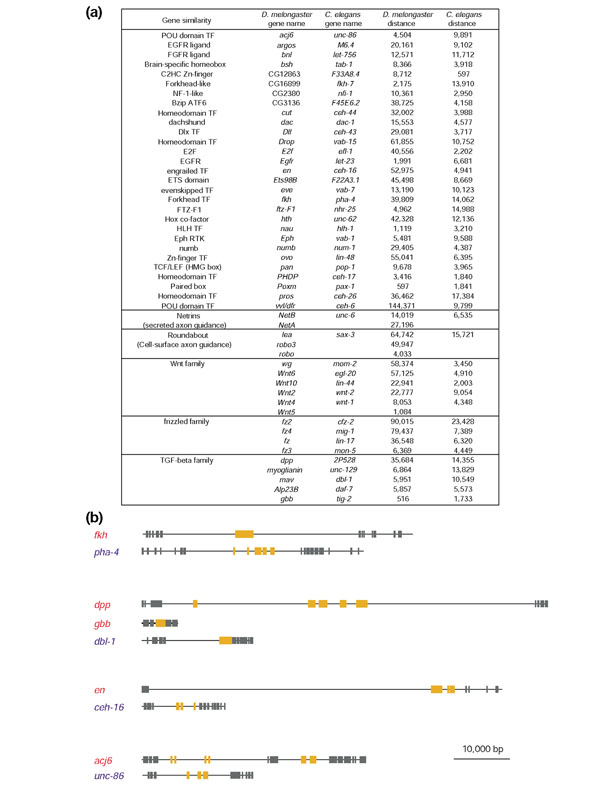
Results: To investigate this, we examined the relationship between regulatory complexity and gene spacing in Caenorhabditis elegans and Drosophila melanogaster. We found that gene density directly reflects local regulatory complexity, such that the amount of noncoding DNA between a gene and its nearest neighbors correlates positively with that gene's regulatory complexity. Genes with complex functions are flanked by significantly more noncoding DNA than genes with simple or housekeeping functions. Genes of low regulatory complexity are associated with approximately the same amount of noncoding DNA in D. melanogaster and C. elegans, while loci of high regulatory complexity are significantly larger in the more complex animal. Complex genes in C. elegans have larger 5' than 3' noncoding intervals, whereas those in D. melanogaster have roughly equivalent 5' and 3' noncoding intervals.

Conclusions: Intergenic distance, and hence genome architecture, is highly nonrandom. Rather, it is shaped by regulatory information contained in noncoding DNA. Our findings suggest that in compact genomes, the species-specific loss of nonfunctional DNA reveals a landscape of regulatory information by leaving a profile of functional DNA in its wake.


Figures

Figure 1
Figure 1
Genes of low regulatory complexity are common and genes of high regulatory complexity are rare in D. melanogaster and C. elegans. Distribution of genes with respect to complexity of expression in (a) FlyBase index (FBx), (b) BDGP in situ hybridization index (BDGPx), and (c) WormBase index (WBx). In all three cases, the distributions are heavily weighted toward genes expressed in a small number of locations and show relatively few genes deployed in a large number of tissues.
Figure 2
Figure 2
Intergenic DNA increases with regulatory complexity in D. melanogaster and C. elegans. Expression indices were divided into bins, each containing approximately 10% of the entries in an index. Mean amount of intergenic DNA for each bin (± standard error) was plotted for all three expression indices (left): (a) FBx; (b) BDGPx; (c) WBx. The average amount of intergenic DNA flanking the genes in bins of greater regulatory complexity is significantly greater than that of bins of lower regulatory complexity in all three indices (Tukey-Kramer HSD, α = 0.05). In the nonparametric bivariate density plots of intergenic DNA versus index value (right), each contour represents a boundary including 10% of the data. The innermost red contour includes 10% of the data points and excludes the other 90%. The outermost purple contour includes 90% of the data points, whereas 10% fall outside this boundary.
Figure 3
Figure 3
Regions of low gene density contain significantly more genes of high regulatory complexity. (a) Window size (in base pairs) of an 11-gene sliding window across the X chromosome versus position along the chromosome. The horizontal line at 250,000 bp indicates the cutoff above which a window was designated as low density. A total of 53 windows larger than 250,000 bp were identified on the X chromosome. These windows overlap to generate 14 independent peaks, numbered 1 through 14. Normalized FBx and BDGPx scores for each gene were calculated by dividing the raw index score by the maximum score for that index. The normalized scores of all low-density windows were compared to the scores of all 11-gene windows on the chromosome. The expression complexity score for low gene density windows was significantly greater than the average score for all possible windows on the X chromosome (Welch ANOVA, p < 0.008; Wilcoxon two-sample test, p < 0.03). (b) The 11 genes flanking the highest point of each numbered peak on the X chromosome. Genes boxed in red fall in the top 20% of expression complexity by FBx or the top 24% by BDGPx. Genes in unshaded boxes have expression data available, but do not fall in the upper range of the FBx or BDGP indices. Genes that are shaded, which represent the majority of genes in these windows, have no expression data available. This panel indicates only genes in the highest central peak. However, all genes within windows exceeding 250,000 bp in size were used for the statistical analysis described above.
Figure 4
Figure 4
Functionally complex genes have more intergenic DNA than functionally simple genes. A comparison of intergenic distances among genes of different GO groups. The mean and median amounts of flanking intergenic DNA are shown for various functional categories of genes in (a) D. melanogaster and (b) C. elegans (black points and bars indicate mean value ± standard error; red bars indicate median values, red boxes enclose 25th-75th percentiles). Genes with low regulatory complexity are represented by the CDY, general RNA polymerase II (PolII) transcription factors, ribosomal components, metabolism, and housekeeping gene sets. Genes of high regulatory complexity are represented by receptor activity, cell differentiation, genes involved in embryonic development, genes involved in pattern specification, and specific RNA PolII transcription factors. All sets of low regulatory complexity have significantly less flanking intergenic DNA than all sets of high regulatory complexity regardless of species (Tukey-Kramer HSD, α = 1 × 10⁻⁴).
Figure 5
Figure 5
Complex genes have more intergenic DNA in D. melanogaster than in C. elegans. (a) Mean 5' flanking DNA (5'), 3' flanking DNA (3'), and total intergenic DNA (T; all ± standard error) is shown for nonredundant groups of simple genes (CDY, general RNA PolII transcription factors, ribosomal components, metabolism, and housekeeping) and complex genes (embryonic development, pattern specification, and specific RNA PolII transcription factors) in C. elegans (blue) and D. melanogaster (red). C. elegans complex genes have significantly more 5' flanking DNA than 3' flanking DNA (Wilcoxon two-sample test, p < 0.0001). The C. elegans complex group is flanked by significantly less DNA than the D. melanogaster complex group (Tukey-Kramer HSD, α = 1 × 10⁻⁴). (b) Distribution of intergenic DNA for all genes in C. elegans (blue) and D. melanogaster (red). In general, genes in C. elegans are more evenly spaced than in D. melanogaster. The largest class of genes in D. melanogaster has less than 1,000 bp of intergenic DNA separating neighboring genes, whereas the largest class in C. elegans has 1,000-2,000 bp. Thus, D. melanogaster does not have a euchromatic genome that is generally expanded with respect to C. elegans, even though it has many more genes with greater than 19,000 bp of flanking intergenic DNA.
Figure 6
Figure 6
Developmentally important genes in D. melanogaster have larger intergenic intervals than their C. elegans counterparts. (a) Forty-nine developmentally important genes from D. melanogaster and their C. elegans counterparts. Genes in the top section represent orthologs, defined by KOG. Subsequent sections represent gene families. Listing of genes in different species on the same line within gene families does not imply that they are orthologous. The mean intergenic size for the D. melanogaster genes is 27,928 bp. Then mean intergenic size for the C. elegans genes is 7,670 bp. (b) Genomic regions of four representative gene sets in D. melanogaster (red) and C. elegans (blue). Orange boxes designate exons of the indicated genes. Gray boxes designate exons of neighboring genes. Note that genomic intervals are typically larger in D. melanogaster than in C. elegans, often owing to both larger flanking noncoding regions and larger introns. The total euchromatic genome of D. melanogaster is estimated at 117 Mb and the euchromatic genome of C. elegans is estimated at 100 Mb. The overall gene distribution within the genome is denser in flies than worms, suggesting that the larger regions of noncoding DNA associated with these representative complex genes are specifically allocated to these loci.

References

    1. Grewal SI, Moazed D. Heterochromatin and epigenetic control of gene expression. Science. 2003;301:798–802. doi: 10.1126/science.1086887. - DOI - PubMed
    1. Bernardi G. The human genome: organization and evolutionary history. Annu Rev Genet. 1995;29:445–476. doi: 10.1146/annurev.ge.29.120195.002305. - DOI - PubMed
    1. Mouchiroud D, D'Onofrio G, Aissani B, Macaya G, Gautier C, Bernardi G. The distribution of genes in the human genome. Gene. 1991;100:181–187. doi: 10.1016/0378-1119(91)90364-H. - DOI - PubMed
    1. D'Onofrio G. Expression patterns and gene distribution in the human genome. Gene. 2002;300:155–160. doi: 10.1016/S0378-1119(02)01048-X. - DOI - PubMed
    1. Gellon G, McGinnis W. Shaping animal body plans in development and evolution by modulation of Hox expression patterns. BioEssays. 1998;20:116–125. doi: 10.1002/(SICI)1521-1878(199802)20:2<116::AID-BIES4>3.3.CO;2-N. - DOI - PubMed

Publication types

MeSH terms

LinkOut - more resources