

Comparative genomics of gene-family size in closely related bacteria
- PMID: 15059260
- PMCID: PMC395786
- DOI: 10.1186/gb-2004-5-4-r27
Comparative genomics of gene-family size in closely related bacteria
Abstract
Background: The wealth of genomic data in bacteria is helping microbiologists understand the factors involved in gene innovation. Among these, the expansion and reduction of gene families appears to have a fundamental role in this, but the factors influencing gene family size are unclear.
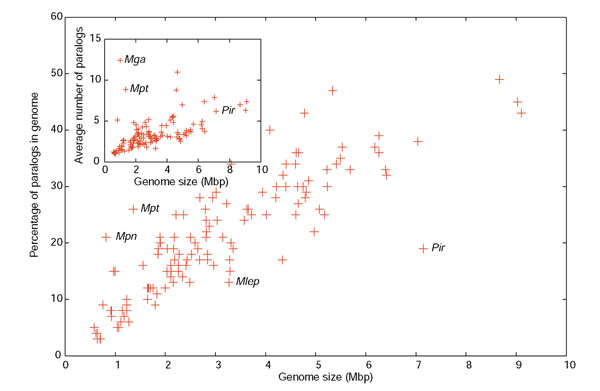
Results: The relative content of paralogous genes in bacterial genomes increases with genome size, largely due to the expansion of gene family size in large genomes. Bacteria undergoing genome reduction display a parallel process of redundancy elimination, by which gene families are reduced to one or a few members. Gene family size is also influenced by sequence divergence and physiological function. Large gene families show wider sequence divergence, suggesting they are probably older, and certain functions (such as metabolite transport mechanisms) are overrepresented in large families. The size of a given gene family is remarkably similar in strains of the same species and in closely related species, suggesting that homologous gene families are vertically transmitted and depend little on horizontal gene transfer (HGT).
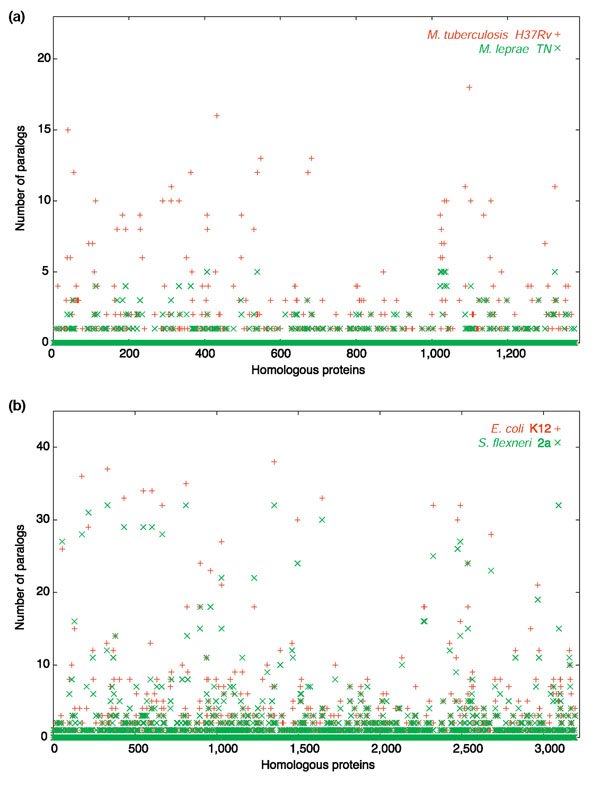
Conclusions: The remarkable preservation of copy numbers in widely different ecotypes indicates a functional role for the different copies rather than simply a back-up role. When different genera are compared, the increase in phylogenetic distance and/or ecological specialization disrupts this preservation, albeit in a gradual manner and maintaining an overall similarity, which also supports this view. HGT can have an important role, however, in nonhomologous gene families, as exemplified by a comparison between saprophytic and enterohemorrhagic strains of Escherichia coli.
Figures


Similar articles
-
[Genome analysis of pathogenic bacteria].Tanpakushitsu Kakusan Koso. 2001 Dec;46(16 Suppl):2400-6. Tanpakushitsu Kakusan Koso. 2001. PMID: 11802401 Review. Japanese. No abstract available.
-
Duplication is more common among laterally transferred genes than among indigenous genes.Genome Biol. 2003;4(8):R48. doi: 10.1186/gb-2003-4-8-r48. Epub 2003 Jul 11. Genome Biol. 2003. PMID: 12914657 Free PMC article.
-
Phylogenetics and the cohesion of bacterial genomes.Science. 2003 Aug 8;301(5634):829-32. doi: 10.1126/science.1086568. Science. 2003. PMID: 12907801
-
Functional genomics and expression analysis of the Corynebacterium glutamicum fpr2-cysIXHDNYZ gene cluster involved in assimilatory sulphate reduction.BMC Genomics. 2005 Sep 13;6:121. doi: 10.1186/1471-2164-6-121. BMC Genomics. 2005. PMID: 16159395 Free PMC article.
-
The role of horizontal gene transfer in the evolution of selected foodborne bacterial pathogens.Food Chem Toxicol. 2009 May;47(5):951-68. doi: 10.1016/j.fct.2008.02.006. Epub 2008 Feb 14. Food Chem Toxicol. 2009. PMID: 18420329 Review.
Cited by
-
Streamlining and core genome conservation among highly divergent members of the SAR11 clade.mBio. 2012 Sep 18;3(5):e00252-12. doi: 10.1128/mBio.00252-12. Print 2012. mBio. 2012. PMID: 22991429 Free PMC article.
-
Horizontal transfer, not duplication, drives the expansion of protein families in prokaryotes.PLoS Genet. 2011 Jan 27;7(1):e1001284. doi: 10.1371/journal.pgen.1001284. PLoS Genet. 2011. PMID: 21298028 Free PMC article.
-
Implications of high level pseudogene transcription in Mycobacterium leprae.BMC Genomics. 2009 Aug 25;10:397. doi: 10.1186/1471-2164-10-397. BMC Genomics. 2009. PMID: 19706172 Free PMC article.
-
Genome-wide identification and characterization of AP2/ERF gene superfamily during flower development in Actinidia eriantha.BMC Genomics. 2022 Sep 13;23(1):650. doi: 10.1186/s12864-022-08871-4. BMC Genomics. 2022. PMID: 36100898 Free PMC article.
-
Comparative Genomics of Bacillus species and its Relevance in Industrial Microbiology.Genomics Insights. 2013 Aug 18;6:25-36. doi: 10.4137/GEI.S12732. eCollection 2013. Genomics Insights. 2013. PMID: 26217108 Free PMC article. Review.
References
-
- Ohno S. Evolution by Gene Duplication. New York: Springer; 1970.
-
- Liang P, Labedan B, Riley M. Physiological genomics of Escherichia coli protein families. Physiol Genomics. 2002;9:15–26. - PubMed
Publication types
MeSH terms
LinkOut - more resources
Full Text Sources
Molecular Biology Databases
