

doi: 10.1186/gb-2004-5-4-r29.
Epub 2004 Mar 30.
Enriching for direct regulatory targets in perturbed gene-expression profiles
Affiliations
- PMID: 15059262
- PMCID: PMC395788
- DOI: 10.1186/gb-2004-5-4-r29
Item in Clipboard
Enriching for direct regulatory targets in perturbed gene-expression profiles
Genome Biol.
2004.
Abstract
Here we build on a previously proposed algorithm to infer direct regulatory relationships using gene-expression profiles from cells in which individual genes are deleted or overexpressed. The updated algorithm can process networks containing feedback loops, incorporate positive and negative regulatory relationships during network reconstruction, and utilize data from double mutants to resolve ambiguous regulatory relationships. When applied to experimental data the reconstruction procedure preferentially retains direct transcription factor-target relationships.
Figures

Graphical representation of genetic regulatory networks. (a) A sample regulatory network; (b) its adjacency list; (c) its accessibility list; and (d) its condensation. (e) The reconstruction of this network, mapped onto the original nodes. Circles represent nodes, or genes, and arrows represent edges.
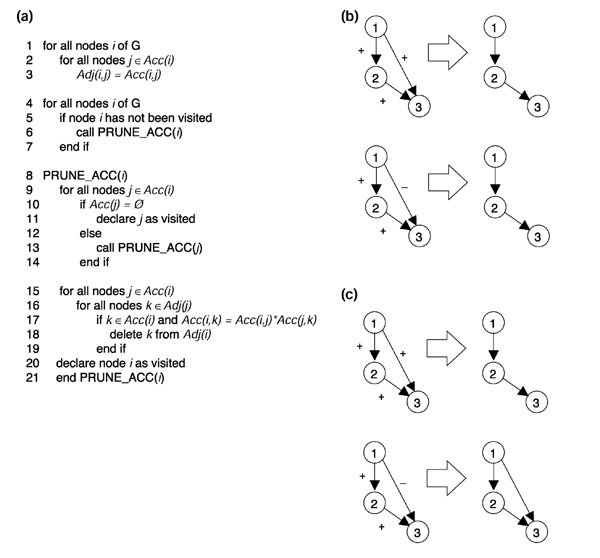
Edge-removal criteria. (a) Pseudocode of the algorithm including positive and negative regulation. Acc(i) and Adj(i) indicate the accessibility and adjacency lists for gene i, respectively, and Acc(i,j) indicates the value (+1 or -1) of the edge from i to j. (b) The original algorithm will pare away any edge connecting two nodes that already have a pathway between them. (c) Algorithm taking positive and negative regulation into account will only pare away an edge if its sign is equal to the product of the signs of the remaining edges in the pathway.

Refining network structure with double-mutant data. (a) Pseudocode of the extension utilizing double-mutant data. Acc-j(i) indicates the accessibility list of gene i in the absence of gene j. i, j, k, and l are arbitrary indices for genes in the network. (b) An example of a three-gene cycle (top), its single-mutant accessibility lists (bottom left) and a reconstruction based on that data (bottom right). (c) The double-mutant accessibility lists for the cycle in (b) and the reconstruction process. For each set of double-mutant data (left), edges revealed to be indirect are removed from the reconstruction (right). The notation [1] 2 > indicates the accessibility list of gene 2 in a strain in which gene 1 is already perturbed. (d) A network in which genes 1 and 2 redundantly regulate gene 3 (right), and single-mutant and double-mutant accessibility lists for the network (left). (e) A network in which gene 1 regulates the activity of gene 3 indirectly by modifying the activity of a direct regulator, gene 2 (right); single- and double-mutant accessibility lists (left).

Feedback loops in the yeast network: one controlling ergosterol biosynthesis (left) and another controlling purine biosynthesis (right). Pointed arrows indicate positive regulation while blunt-ended arrows indicate negative regulation; only statistically significant relationships are shown.
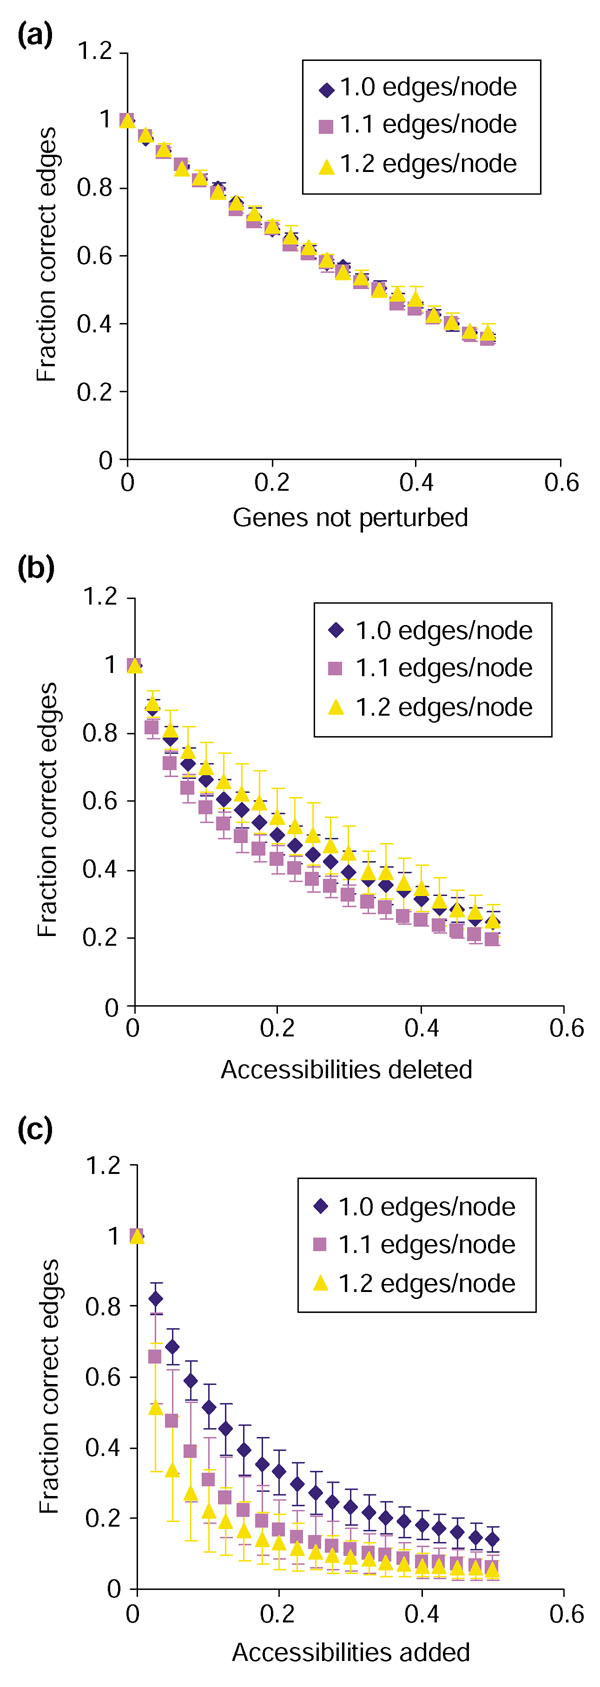
Sensitivity of the algorithm to incomplete or noisy data. On the y-axis of each graph is the fraction correct edges, (E - fn)/(E + fp), where E is the number of edges in the correct graph, and fn and fp are the number of false-negative and false-positive edges in the reconstruction. On the x-axis is (a) fraction of genes for which no accessibility information is available, (b) fraction of false-negative accessibilities, or (c) fraction of false-positive accessibilities. All data is for synthetic 500-gene networks with 500, 550, or 600 edges and edge distribution as described in Materials and methods. Each data point represents the average ± standard deviation of 10 repetitions for each of six independent networks.
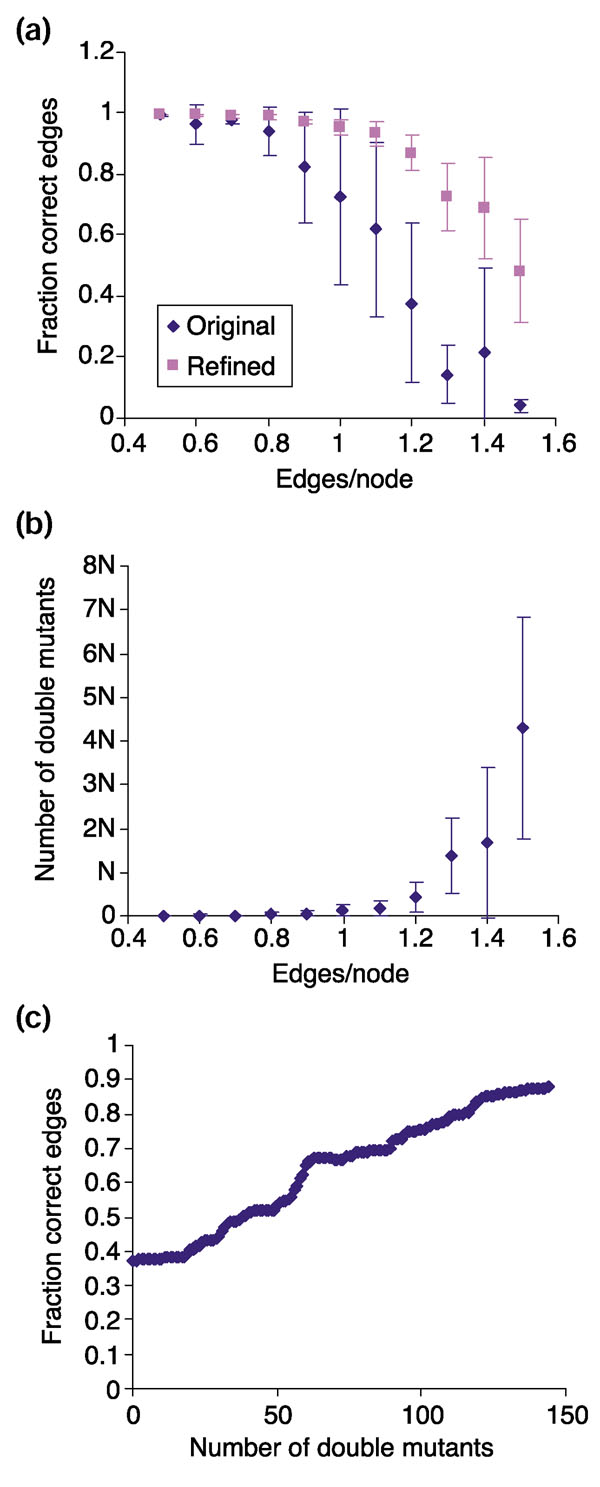
Quality of reconstruction using double-mutant data. (a) Fraction of correct edges in reconstruction (including cycles) versus edge density using single-mutant data only (original) or including double-mutant data (refined). (b) Number of double mutants needed for accurate reconstruction of networks with different numbers of edges, as compared to the number of genes in the network, N. (c) Improvement of reconstruction as double-mutant data is added for a network with 1.2 edges per node. All synthetic networks had 500 genes and the indicated number of edges. Data in (c) is for one of the four independent networks analyzed in (a) and (b), where each data point represents the average ± standard deviation for four independent networks.
References
Publication types
MeSH terms
Substances
LinkOut - more resources
Full Text Sources
Molecular Biology Databases
