

Comparative recombination rates in the rat, mouse, and human genomes
- PMID: 15059993
- PMCID: PMC383296
- DOI: 10.1101/gr.1970304
Comparative recombination rates in the rat, mouse, and human genomes
Abstract
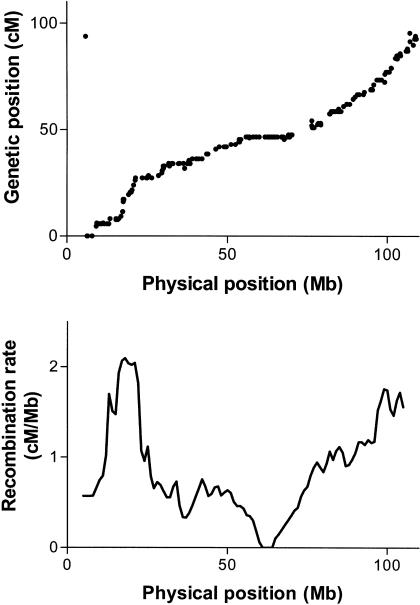
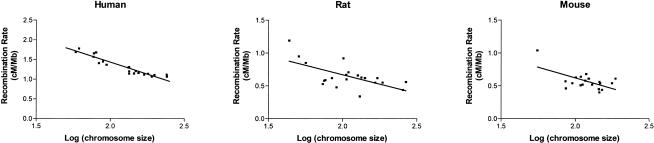
Levels of recombination vary among species, among chromosomes within species, and among regions within chromosomes in mammals. This heterogeneity may affect levels of diversity, efficiency of selection, and genome composition, as well as have practical consequences for the genetic mapping of traits. We compared the genetic maps to the genome sequence assemblies of rat, mouse, and human to estimate local recombination rates across these genomes. Humans have greater overall levels of recombination, as well as greater variance. In rat and mouse, the size of the chromosome and proximity to telomere have less effect on local recombination rate than in human. At the chromosome level, rat and mouse X chromosomes have the lowest recombination rates, whereas human chromosome X does not show the same pattern. In all species, local recombination rate is significantly correlated with several sequence variables, including GC%, CpG density, repetitive elements, and the neutral mutation rate, with some pronounced differences between species. Recombination rate in one species is not strongly correlated with the rate in another, when comparing homologous syntenic blocks of the genome. This comparative approach provides additional insight into the causes and consequences of genomic heterogeneity in recombination.
Figures
References
-
- Aquadro, C.F. 1997. Insights into the evolutionary process from patterns of DNA sequence variability. Curr. Opin. Genet. 7: 835-840. - PubMed
-
- Bartolomé, C., Maside, X., and Charlesworth, B. 2002. On the abundance and distribution of transposable elements in the genome of Drosophila melanogaster. Mol. Biol. Evol. 19: 926-937. - PubMed
-
- Begun, D.J. and Aquadro, C.F. 1992. Levels of naturally occurring DNA polymorphism correlate with recombination rates in D. melanogaster. Nature 356: 519-520. - PubMed
WEB SITE REFERENCES
-
- http://www.genome.ucsc.edu; University of California–Santa Cruz Genome Bioinformatics site.
-
- http://www.ratmap.gen.gu.se; RatMap.
Publication types
MeSH terms
Grants and funding
LinkOut - more resources
Full Text Sources
Other Literature Sources
Miscellaneous