Comparative Study
. 2004 Apr;14(4):631-9.
doi: 10.1101/gr.1987704.

The genomic sequence and comparative analysis of the rat major histocompatibility complex

Affiliations
Comparative Study

The genomic sequence and comparative analysis of the rat major histocompatibility complex

Peter Hurt et al. Genome Res. 2004 Apr.

Abstract

We have determined the sequence of a 4-Mb interval on rat chromosome 20p12 that encompasses the rat major histocompatibility complex (MHC). This is the first report of a finished sequence for a segment of the rat genome and constitutes one of the largest contiguous sequences thus far for rodent genomes in general. The rat MHC is, next to the human MHC, the second mammalian MHC sequenced to completion. Our analysis has resulted in the identification of at least 220 genes located within the sequenced interval. Although gene content and order are well conserved in the class II and class III gene intervals as well as the framework gene regions, profound rat-specific features were encountered within the class I gene regions, in comparison to human and mouse. Class I region-associated differences were found both at the structural level, the number, and organization of class I genes and gene families, and, in a more global context, in the way that evolution worked to shape the present-day rat MHC.


Figures

Figure 1
Figure 1
Comparative analysis of structure and sequence of the MHC region in mouse H2 (top), rat RT1 (center), and human HLA (bottom). We detected considerable differences in the size of orthologous regions in rat, human, and mouse. Regions are color-coded, based on their gene content. Red, class I gene regions; blue, class II gene regions; yellow, framework gene regions including class III regions. Positions of selected framework genes, indicative of borders between class I, class II, and class III intervals and framework regions are shown. Four horizontal “heat map” bars embedded within the diagram that represent RT1 describe sequence features. RT1 vs. H2, comparison of 3.8-Mb RT1 sequence to H2. Finished sequence of the complete mouse MHC from a single haplotype is not yet available. We have therefore merged 1.7-Mb finished sequence from proximal H2 (haplotype bc; NT_002588) with whole-genome shotgun (WGS) draft sequence (haplotype b; NT_039650). RT1 vs. HLA, comparison of 3.8-Mb RT1 sequence to HLA (NT007592; segment 20-25 Mb). Class I α1- and α3-domain homologies were identified by rat RT1-Au gene exons 2 and 4, respectively (from U38972). Analysis was performed using PipMaker. Colors within “heat map” bars indicate the degree of conservation. Red, homology exceeds 70% in 100-bp interval. Green, homology between 50% and 70% within 100 bp. GC content for RT1 and HLA was calculated with a 50-kb window and a shift of 0.2 kb. The rat M3B/M2 region is unconnected to our major contig (indicated by thin line).
Figure 2
Figure 2
Physical map of the RT1 region including the positions of genes, pseudogenes, and gene fragments as detected by our sequence analysis. Nomenclature of non-class I and non-class II genes generally follows LocusLink (http://ncbi.nlm.nih.gov/LocusLink). Where no gene designation in mouse or human exists to date, accession numbers, Riken cDNA clone numbers, or EST designations are used. For brevity, Riken clone 5830469G19-related pseudogenes are designated as Rcrg1-ps, Riken clone 2210412D01-related pseudogenes as Rcrg2-ps, and EST 221625 (AI177969)-related pseudogenes as Nerg-ps. Class I gene fragments of the RT1-N and RT1-M1 regions are designated according to their position (kb) and the domains (a) or exons (ex) present. No unifying nomenclature exists for olfactory receptor genes. Therefore, the designation Or with consecutive numbers was used, leaving a gap for those Or genes that map between Or15 and Or26 according to the Baylor rat genome sequence. The mouse gene (MOR designation) was included in brackets where orthology was evident (see Fig. 5B). Red, class I genes and class I-derived gene fragments; blue, class II genes; purple, non-class I pseudogenes and non-class I gene fragments; green, framework genes (functional genes with exception of class I and class II genes). Map positions are indicated in kilobasepairs. For sake of clarity, the segment between 2450 and 3050 kb is shown at higher resolution (breaks indicated by pair of wavy lines). Sequenced clones are indicated with their library origin and plate coordinates. We used the RPCI-31 and RPCI-32 library resources (Woon et al. 1998). A minimal tiling path consisting of 38 BAC and PAC clones was derived from our previously constructed RT1 contig maps (Walter and Günther 2000; Ioannidu et al. 2001; Walter et al. 2002). Deletions within clones are displayed as dotted lines. We encountered RT1 intervals that were prone to deletions in a number of our clones, that is, between RT1-DMa and RT1-Db1 in the class II region, in interval G6f-Bat5 and proximal to Mog. For these regions, clones sequenced at low redundancy in the rat genome project at Baylor College were identified using BLAST and sequenced to high coverage for gap closure (BAC clones CH230–103E15, CH230–003K4, and CH230–120H07). The three library resources used each represent the rat RT1n haplotype. Clone RPCI31–484K06 containing class I genes RT1-M3-3 and RT1-M2 is connected to the major contig of 3.8 Mb by draft-quality sequence generated at Baylor College.
Figure 2
Figure 2
Physical map of the RT1 region including the positions of genes, pseudogenes, and gene fragments as detected by our sequence analysis. Nomenclature of non-class I and non-class II genes generally follows LocusLink (http://ncbi.nlm.nih.gov/LocusLink). Where no gene designation in mouse or human exists to date, accession numbers, Riken cDNA clone numbers, or EST designations are used. For brevity, Riken clone 5830469G19-related pseudogenes are designated as Rcrg1-ps, Riken clone 2210412D01-related pseudogenes as Rcrg2-ps, and EST 221625 (AI177969)-related pseudogenes as Nerg-ps. Class I gene fragments of the RT1-N and RT1-M1 regions are designated according to their position (kb) and the domains (a) or exons (ex) present. No unifying nomenclature exists for olfactory receptor genes. Therefore, the designation Or with consecutive numbers was used, leaving a gap for those Or genes that map between Or15 and Or26 according to the Baylor rat genome sequence. The mouse gene (MOR designation) was included in brackets where orthology was evident (see Fig. 5B). Red, class I genes and class I-derived gene fragments; blue, class II genes; purple, non-class I pseudogenes and non-class I gene fragments; green, framework genes (functional genes with exception of class I and class II genes). Map positions are indicated in kilobasepairs. For sake of clarity, the segment between 2450 and 3050 kb is shown at higher resolution (breaks indicated by pair of wavy lines). Sequenced clones are indicated with their library origin and plate coordinates. We used the RPCI-31 and RPCI-32 library resources (Woon et al. 1998). A minimal tiling path consisting of 38 BAC and PAC clones was derived from our previously constructed RT1 contig maps (Walter and Günther 2000; Ioannidu et al. 2001; Walter et al. 2002). Deletions within clones are displayed as dotted lines. We encountered RT1 intervals that were prone to deletions in a number of our clones, that is, between RT1-DMa and RT1-Db1 in the class II region, in interval G6f-Bat5 and proximal to Mog. For these regions, clones sequenced at low redundancy in the rat genome project at Baylor College were identified using BLAST and sequenced to high coverage for gap closure (BAC clones CH230–103E15, CH230–003K4, and CH230–120H07). The three library resources used each represent the rat RT1n haplotype. Clone RPCI31–484K06 containing class I genes RT1-M3-3 and RT1-M2 is connected to the major contig of 3.8 Mb by draft-quality sequence generated at Baylor College.
Figure 3
Figure 3
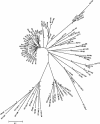
Phylogenetic tree analysis of rat class I genes identified in the RT1n genomic sequence determined by us, combined with mouse class I gene sequences (rat gene prefix RT1; mouse gene prefix H2). Noteworthy are the species-specific amplification of A and CE genes in rat and H2-K, -D, -L genes in mouse. The class I genes in the rat N, mouse T, and in the M-gene regions of both species show clear orthology, with radiation in some cases that took place after species divergence, for example, the RT1-T24 and RT1-M10 families. A minimum evolution tree was generated by calculating Jukes-Cantor distance based on class I gene exons 2–8. Asterisks and open circles indicate bootstrap levels (500 replicates) of ≥95% and ≥70%, respectively.
Figure 4
Figure 4
Independent evolution of proximal and first distal class I gene cluster in rat and mouse. (A) We detected a total of seven partial homologies to the Sacm2l gene in class I gene regions RT1-A and -CE, four of which match the 3′-end of Sacm2l (position 138894–139294). A similar transposition occurred in mouse leading to the presence of a Sacm2l-gene fragment in the H2-D/Q region (position 1554403–1554806 in NM_002588). Our phylogenetic analysis indicates that duplication and transposition took place after the speciation of mouse and rat. (B) Phylogenetic relationship between pseudogenes with homology to mouse gene LOC224733 in the MHC of rat and mouse. LOC224733-like sequences 1 and 2 are located in the rat A region; LOC224733-like sequences 3 to 9 map to rat CE (Fig. 2). The localization of 10 LOC224733-derived copies in mouse H2-K and H2-D is indicated. Species-specific clustering supports independent transposition and amplification of LOC224733 elements in rat and mouse. We calculated neighbor-joining trees as implemented in CLUSTALX. Bootstrap values (1000 replicates) are indicated.
Figure 5
Figure 5
(A) Phylogenetic relationship of butyrophilin-like genes located in the proximal part of the class III region (position 558–792 kb). Rat genes Btnl4 to Btnl9 and mouse genes Btnl4 to Btnl7 duplicated and diverged after the split of the rat and mouse lineages (mouse Btnl7 corresponds to accession number AF030001). (B) Phylogenetic analysis of rat (Or) and mouse olfactory receptor (MOR designation) genes in the distal part of the MHC. Considerable orthology is detected among rat and mouse olfactory receptors. Trees were generated using UPGMA (A) and minimum evolution (B). Asterisks and open circles indicate bootstrap levels (500 replicates) of ≥95% and ≥70%, respectively.

Similar articles

Cited by

References

    1. Amadou, C. 1999. Evolution of the MHC class I region: The framework hypothesis. Immunogenetics 49: 362-367. - PubMed
    1. Anzai, T., Shiina, T., Kimura, N., Yanagiya, K., Kohara, S., Shigenari, A., Yamagata, T., Kulski, J.K., Naruse, T.K., Fujimori, Y., et al. 2003. Comparative sequencing of human and chimpanzee MHC class I regions unveils insertions/deletions as the major path to genomic divergence. Proc. Natl. Acad. Sci. 100: 7708-7713. - PMC - PubMed
    1. Chardon, P., Renard, C., Rogel-Gaillard, C., Cattolico, L., Duprat, S., Vaiman, M., and Renard, C. 2001. Sequence of the swine major histocompatibility complex region containing all nonclassical class I genes. Tissue Antigens 57: 55-65. - PubMed
    1. Druet, E., Sapin, C., Günther, E., Feingold, N., and Druet, P. 1977. Mercuric chloride-induced antiglomerular basement membrane antibodies in the rat: Genetic control. Eur. J. Immunol. 7: 348-351. - PubMed
    1. Ewing, B. and Green, P. 1998. Base-calling of automated sequencer traces using phred. II. Error probabilities. Genome Res. 8: 186-194. - PubMed

WEB SITE REFERENCES

    1. http://www.rzpd.de; German Resource Center.
    1. http://www.sanger.ac.uk/Software/sequencing/docs/phrap2gap; Sequence assembly software.
    1. http://www.ornl.gov/hgmis/research/bermuda.html#1; Policies on release of genomic sequence data.
    1. http://ncbi.nlm.nih.gov/LocusLink; LocusLink database. Provides a single query interface to curated sequence and descriptive information about genetic loci.

Publication types

Associated data