

Applications of a rat multiple tissue gene expression data set
- PMID: 15060018
- PMCID: PMC383321
- DOI: 10.1101/gr.2161804
Applications of a rat multiple tissue gene expression data set
Abstract
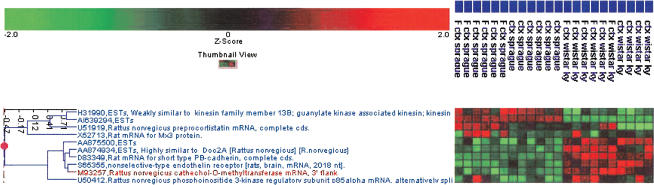
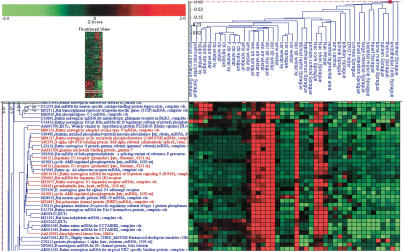
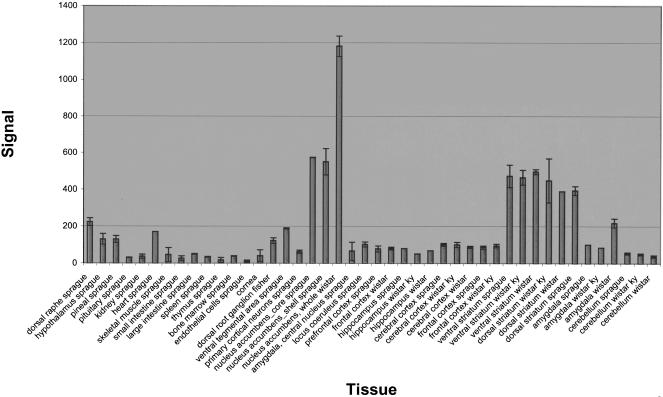
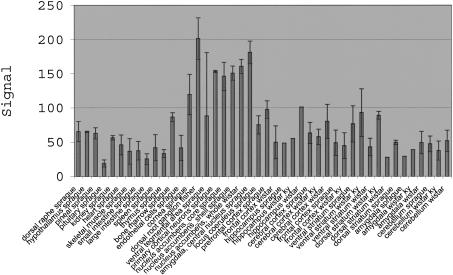
With the sequencing and assembly of the rat genome comes the difficult task of assigning functions to genes. Tissue localization of gene expression gives some information about the potential role of a gene in physiology. Various examples of the utility of multiple tissue gene expression data sets are illustrated here. First, we highlight their use in finding genes that might play an important role in a particular tissue on the basis of exclusive expression in that tissue or coexpression with a gene or genes with known function. Second, we show how this data might be used to explain known phenotypic differences between strains. Third, we show how expression patterns of genes in a genomic interval might identify candidate genes in quantitative trait loci (QTL) mapping studies. Lastly, we show how multiple tissue and species data can help researchers prioritize follow up studies to microarray experiments. All of these applications of multiple tissue gene expression data sets will play a role in functionally annotating the rat genome.
Figures
References
-
- Baldessarini, R.J. 1996. Drugs and the treatment of psychiatric disorders. In The pharmacological basis of therapeutics, 9th Ed. (eds. P.B. Molinoff and R.W. Ruddon), pp. 431-459. McGraw-Hill, New York.
-
- Bell, S.M., Reynolds, J.G., Thiele, T.E., Gan, J., Figlewicz, D.P., and Woods, S.C. 1998. Effects of third intracerebroventricular injections of corticotropin-releasing factor (CRF) on ethanol drinking and food intake. Psychopharmacology 139: 128-135. - PubMed
-
- Bice, P., Foroud, T., Bo, R., Castelluccio, P., Lumeng, L., Li, T.-K., and Carr, L.G. 1998. Genomic screen for QTLs underlying alcohol consumption in the P and NP rat lines. Mamm. Genome 9: 949-955. - PubMed
-
- Brundege, J.M. and Williams, J.T. 2002. Differential modulation of nucleus accumbens synapses. J. Neurophysiol. 2002. 88: 142-151. - PubMed
-
- Carr, L.G., Foroud, T., Bice, P., Gobbett, T., Ivashina, J., Edenberg, H., Lumeng, L., and Li, T.K. 1998. A quantitative trait locus for alcohol consumption in selectively bred rat lines. Alcohol Clin. Exp. Res. 22: 884-887. - PubMed
WEB SITE REFERENCES
-
- http://expression.gnf.org; GNF GeneAtlas Web site.
-
- http://expression.gnf.org/ratlas; RAtlas link from GNF GeneAtlas Web site.
-
- http://www.ncbi.nlm.nih.gov/LocusLink/; Locus Link.
-
- http://www.affymetrix.com/support/technical/manuals.affx; Affymetrix Web site technical manuals.
-
- http://www.ncbi.nlm.nih.gov/HomoloGene; Homologene.
Publication types
MeSH terms
LinkOut - more resources
Full Text Sources
Other Literature Sources
Molecular Biology Databases