. 2004 Apr;134(4):1586-97.
doi: 10.1104/pp.103.037820. Epub 2004 Apr 2.

Molecular analyses of the Arabidopsis TUBBY-like protein gene family

Affiliations

Molecular analyses of the Arabidopsis TUBBY-like protein gene family

Chia-Ping Lai et al. Plant Physiol. 2004 Apr.

Abstract

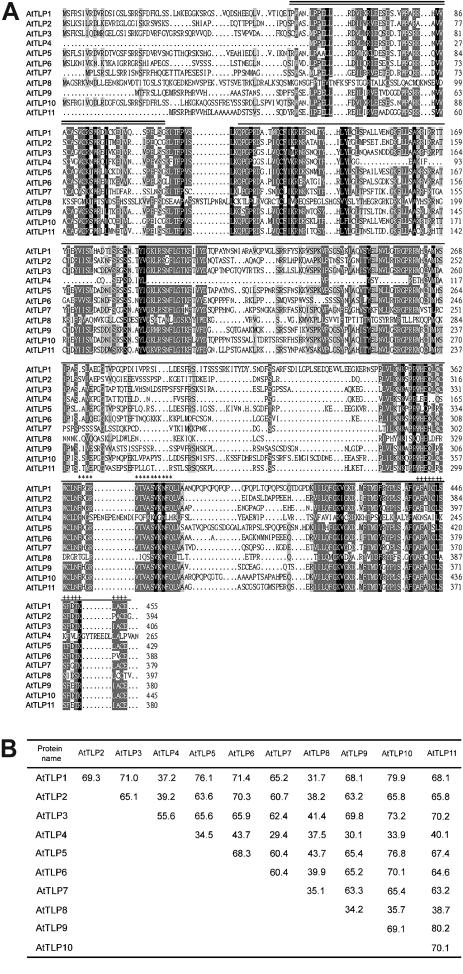
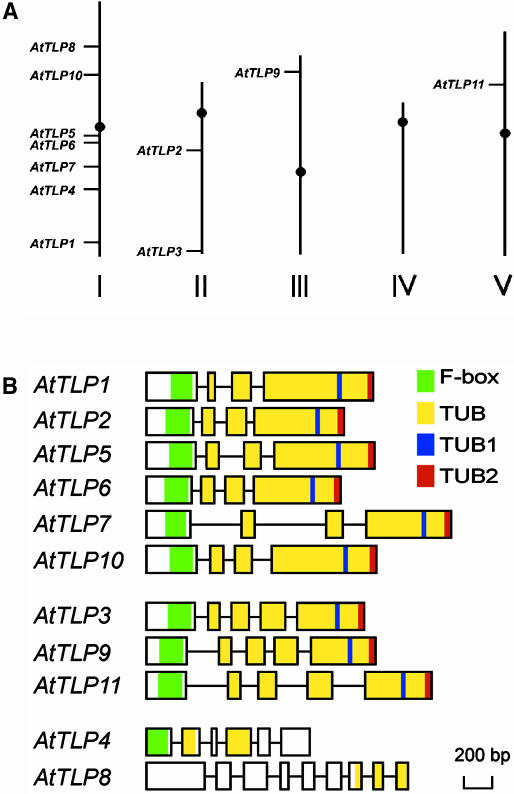
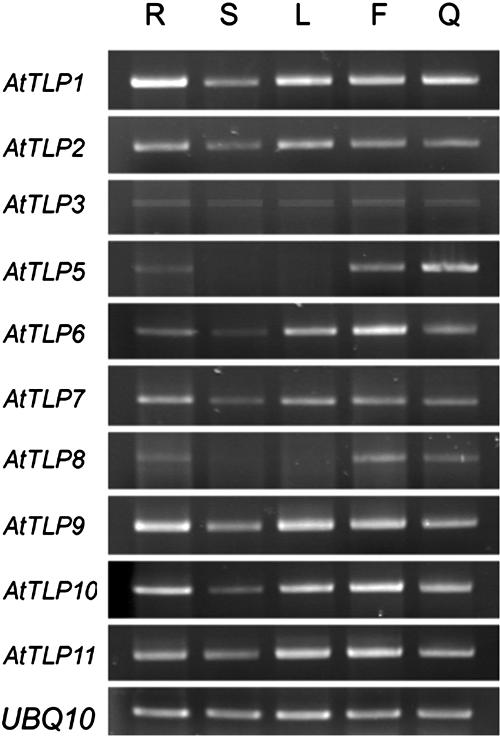
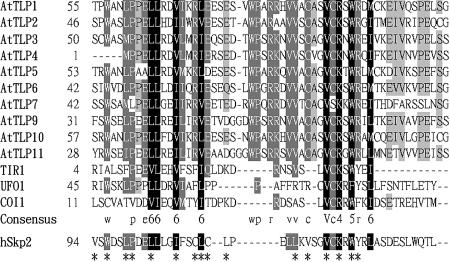
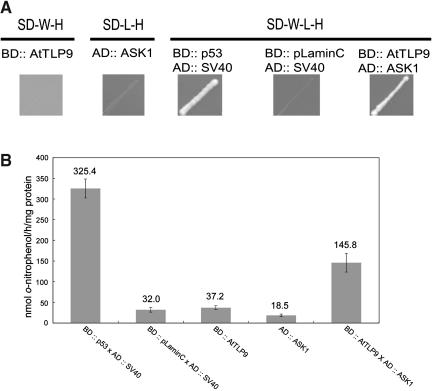
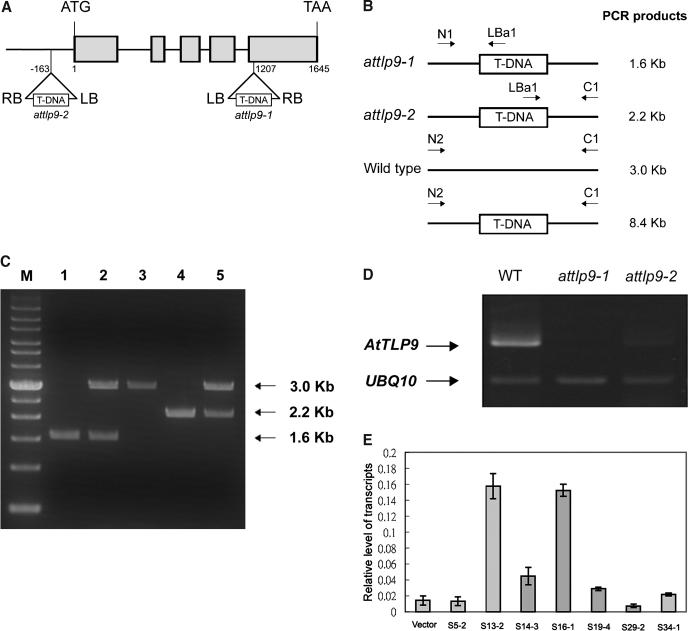
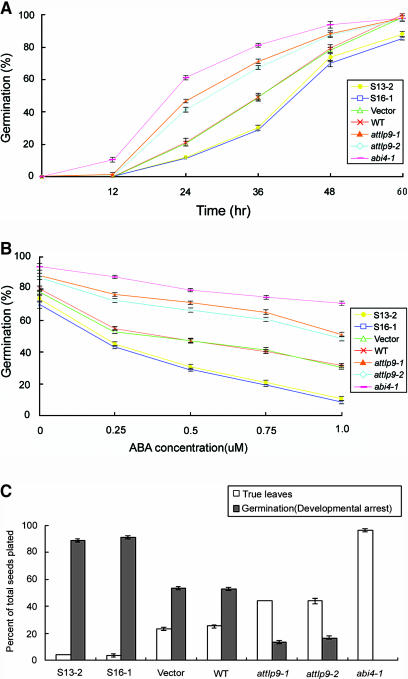
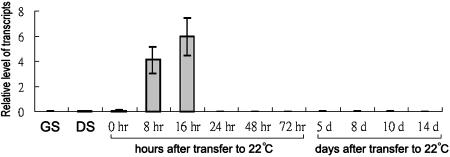
In mammals, TUBBY-like proteins play an important role in maintenance and function of neuronal cells during postdifferentiation and development. We have identified a TUBBY-like protein gene family with 11 members in Arabidopsis, named AtTLP1-11. Although seven of the AtTLP genes are located on chromosome I, no local tandem repeats or gene clusters are identified. Except for AtTLP4, reverse transcription-PCR analysis indicates that all these genes are expressed in various organs in 6-week-old Arabidopsis. AtTLP1, 2, 3, 6, 7, 9, 10, and 11 are expressed ubiquitously in all the organs tested, but the expression of AtTLP5 and 8 shows dramatic organ specificity. These 11 family members share 30% to 80% amino acid similarities across their conserved C-terminal tubby domains. Unlike the highly diverse N-terminal region of animal TUBBY-like proteins, all AtTLP members except AtTLP8 contain a conserved F-box domain (51-57 residues). The interaction between AtTLP9 and ASK1 (Arabidopsis Skp1-like 1) is confirmed via yeast (Saccharomyces cerevisiae) two-hybrid assays. Abscisic acid (ABA)-insensitive phenotypes are observed for two independent AtTLP9 mutant lines, whereas transgenic plants overexpressing AtTLP9 are hypersensitive to ABA. These results suggest that AtTLP9 may participate in the ABA signaling pathway.


Figures

Figure 1.
Figure 1.
Sequence comparisons of the deduced proteins from AtTLPs. A, Sequence alignment of AtTLPs. Identical and similar amino acid residues are shaded in black and gray, respectively. The locations of the F-box domain and tubby domain are indicated with double and single solid lines above the sequences, respectively. Asterisks and crosses shown above the sequences represent TUB1 and TUB2 motifs. Two PROSITE signature patterns are F-[KRHQ]-GR-V-[ST]-x-A-S-V-K-N-F-Q for TUB1 motif and A-F-[AG]-I-[GSAC]-[LIVM]-[ST]-S-F-x-[GST]-K-x-A-C-E for TUB2 motif. The amino acid sequences of AtTLP1-3 and AtTLP5-11 are deduced from the cDNAs reported here. The amino acid sequence of AtTLP4 is deduced from annotated At1g61940. The alignment is generated by the ClustalW program. The search for all known motifs in the deduced amino acid sequences was achieved by the MOTIF SCANNING (Pagni et al., 2001). B, Amino acid similarities among AtTLP C-terminal tubby domain.
Figure 2.
Figure 2.
Location and gene structure comparison of the AtTLP gene family. A, Chromosomal locations of the AtTLP genes. The relative sizes of five Arabidopsis chromosomes are derived from the National Center for Biotechnology Information database. B, The intron-exon structure of the AtTLP gene family. Except for AtTLP4, the positions of the exons/introns of each individual AtTLP gene were confirmed by comparison of the cDNAs with their corresponding genomic DNA sequences. Exons and introns are represented by boxes and lines, respectively. The green and yellow shaded boxes indicate approximate positions encoding the F-box and tubby domain of the AtTLPs. Two PROSITE signature patterns (TUB1 and TUB2 motif) in tubby domain are shown in blue and red shaded boxes, respectively. The scale shown below is in base pairs.
Figure 3.
Figure 3.
RT-PCR analyses of AtTLP gene expression patterns. Root (R), main and lateral stems (S), rosette leaves (L), flower clusters (F), and green siliques (Q) were harvested from 42-d-old plants grown in a growth chamber as described in “Materials and Methods.” Expression of each AtTLP gene was analyzed by RT-PCR using specific primers as described in “Materials and Methods.” The expression level of a UBQ10 gene was used as an internal control.
Figure 4.
Figure 4.
Sequence alignment of the core F-box sequences from AtTLPs, TIR1, UFO, COI1, and the human F-box protein Skp2 were aligned by ClustalW. The amino acid sequence of AtTLP4 is deduced from annotated At1g61940. Identical and similar amino acid residues are shaded with black and gray, respectively. Dots denote gaps. Amino acid substitution groups were numbered according to the Blosum 35 matrix: (1) ED; (2) NQ; (3) ST; (4) KR; (5) FYW; and (6) LIVM. Asterisks indicate the amino acids positions important for the Skp/F-box interactions between human Skp1 and Skp2 (Schulman et al., 2000; Zheng et al., 2002).
Figure 5.
Figure 5.
The interaction between AtTLP9 and ASK1 via yeast two-hybrid assays. p53-SV40 (SV40 T-antigen) and LaminC-SV40 represent known interacting and noninteracting protein partners, respectively. A, Interaction of AtTLP9 and ASK1 with yeast two-hybrid His auxotrophic growth. Yeast cells transformed with the plasmid pairs were cultured on synthetic dropout (SD) medium lacking selected amino acids. SD-W-H, SD media without Trp and His; SD-L-H, SD media without Leu and His; SD-W-L-H, SD media without Trp, Leu, and His. B, β-galactosidase activities of the interaction pairs. Values are the means ± sd of assays from least three independent transformants indicated. β-galactosidase activity is expressed in nmol o-nitrophenol h−1 mg−1 yeast protein.
Figure 6.
Figure 6.
Molecular characterization of AtTLP9 T-DNA insertion lines. A, Schematic presentation of the structure of the AtTLP9 genomic structure. Start ATG and termination codons are indicated. The five exons are represented by gray boxes. The T-DNA location for each of the two attlp9 knockout lines, attlp9-1 and attlp9-2, are indicated. B, Schematic diagrams of the attlp9-1 and attlp9-2 genotyping: N1, forward primer of AtTULP9; LBa1, left-border primer of T-DNA; and C1, reverse primer of AtTLP9. The N1 and LBa1 primers produced the 1.6-kb PCR fragment from the attlp9-1 genomic DNA, and C1 and LBa1 primers produced the 2.2-kb PCR fragment from the attlp9-2 T-DNA genomic DNA; N2 and C1 primers produced a 3.0-kb PCR product from the wild-type DNA, while no PCR band was obtained from the attlp9-1 and attlp9-2 genomic DNA because the expected fragment was too large to amplify. C, Genotype determination for attlp9-1 and attlp9-2. Lane 1, homozygous attlp9-1; lane 2, heterozygous attlp9-1; lane 3, wild type; lane 4, homozygous attlp9-2; and lane 5, heterozygous attlp9-2. M, Mr marker. Size of major PCR products was indicated in kilobase pairs. D, Examination of AtTLP9 transcript in attlp9-1 and attlp9-2 plants. RT-PCR was performed with total RNA extracted from 14-d-old seedlings of attlp9-1, attlp9-2, and the wild type (Col-0) as described in “Materials and Methods.” UBQ10-specific primers were also included as an internal control. E, mRNA level for AtTLP9 gene in 14-d-old seedlings of AtTLP9 sense transgenic plants. Total RNA was extracted from 14-d-old seedlings of vector control and seven independent T3 sense homozygous transgenic plants. Poly(A+) mRNA was isolated, converted to cDNA, and subjected to real-time PCR analysis as described in “Materials and Methods.” Transcript levels are given as relative values to UBQ10 (the value of 1). Each data point represents the mean of triplicate experiments. The small bars represent se. Vector represents transgenic plants carrying the empty vector.
Figure 7.
Figure 7.
AtTLP9 can modulate plant's sensitivity to ABA during seed germination and early seedling development. WT, Columbia wild type; Vector, transgenic plants carrying the empty vector; abi4-1, ABA perception mutant. Plant material was prepared as described in “Materials and Methods.” Each data point represents the mean of triplicate experiments (n = 50 each). The small bars represent se. A, AtTLP9 can modulate the seed germination rate. Seeds of WT, abi4-1, attlp9-1, attlp9-2, and sense transgenic plants S13-2 and S16-1 were plated on ABA-free medium, and germination was scored at time points indicate. B, ABA dose response of seed germination. Seeds were plated on media containing various concentrations of ABA and grown for 2 d. Seedlings with fully emerged radicles were counted. C, Sensitivity of seedling development to ABA. Shown are the percentages of 10-d-old seedlings with developmental arrest and true leaves over total number of seeds planted on Murashige and Skoog media supplemented with 1 μm ABA and 1% Suc.
Figure 8.
Figure 8.
Real-time PCR analysis of AtTLP9 expression during seed maturation, germination, and early development. Wild-type (Col-0) seeds were kept in darkness at 4°C for 3 d, and then seeds for germination test were floated on liquid Murashige and Skoog medium and incubated at 22°C under a 16-h-light/8-h-dark photoperiod for 8, 16, 24, 48, and 72 h (0 indicates the time immediately following transfer), while seeds for early development test were plated on solid medium containing 0.7% phytoagar for 5, 8, 10, and 14 d. Poly(A+) mRNA was isolated, converted to cDNA, and subjected to real-time PCR analysis as described in “Materials and Methods.” Transcript levels are given as relative values to UBQ10 (the value of 1). Each data point represents the mean of triplicate experiments. The small bars represent se. GS, green siliques; DS, dry seeds.

Similar articles

Cited by

References

    1. Bai C, Sen P, Hofmann K, Ma L, Goebl M, Harper JW, Elledge SJ (1996) SKP1 connects cell cycle regulators to the ubiquitin proteolysis machinery through a novel motif, the F-box. Cell 86: 263–274 - PubMed
    1. Bewley JD (1997) Seed germination and dormancy. Plant Cell 9: 1055–1066 - PMC - PubMed
    1. Boggon TJ, Shan WS, Santagata S, Myers SC, Shapiro SL (1999) Implication of tubby proteins as transcription factors by structure-based functional analysis. Science 286: 2119–2125 - PubMed
    1. Clough SJ, Bent AF (1998) Floral dip: a simplified method for Agrobacterium-mediated transformation of Arabidopsis thaliana. Plant J 16: 735–743 - PubMed
    1. Coleman DL, Eicher EM (1990) Fat (fat) and tubby (tub): two autosomal recessive mutations causing obesity syndromes in the mouse. J Hered 81: 424–427 - PubMed

Publication types

MeSH terms