. 2004 Apr 13;101(15):5565-70.
doi: 10.1073/pnas.0401242101. Epub 2004 Apr 2.

Direct continuities between cisternae at different levels of the Golgi complex in glucose-stimulated mouse islet beta cells

Affiliations

Direct continuities between cisternae at different levels of the Golgi complex in glucose-stimulated mouse islet beta cells

Brad J Marsh et al. Proc Natl Acad Sci U S A. .

Abstract

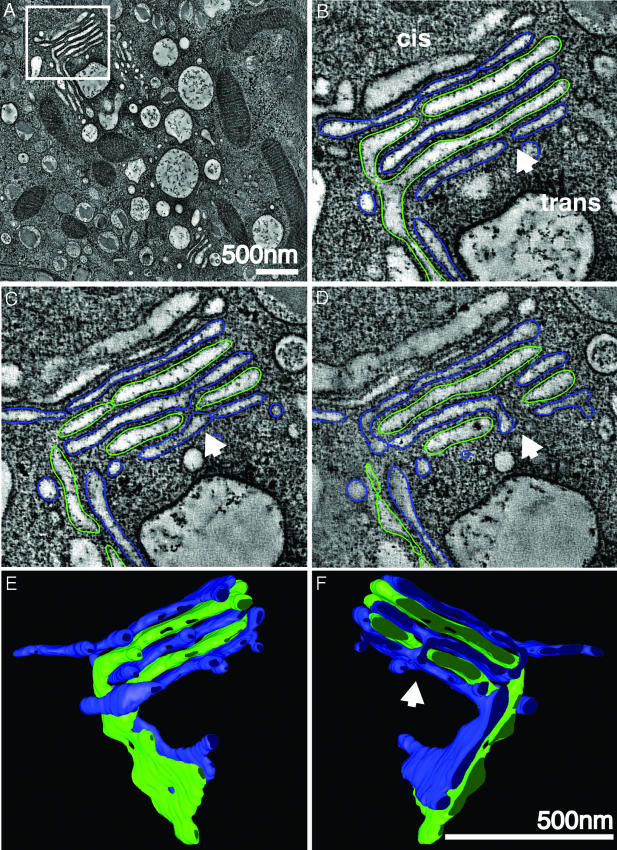
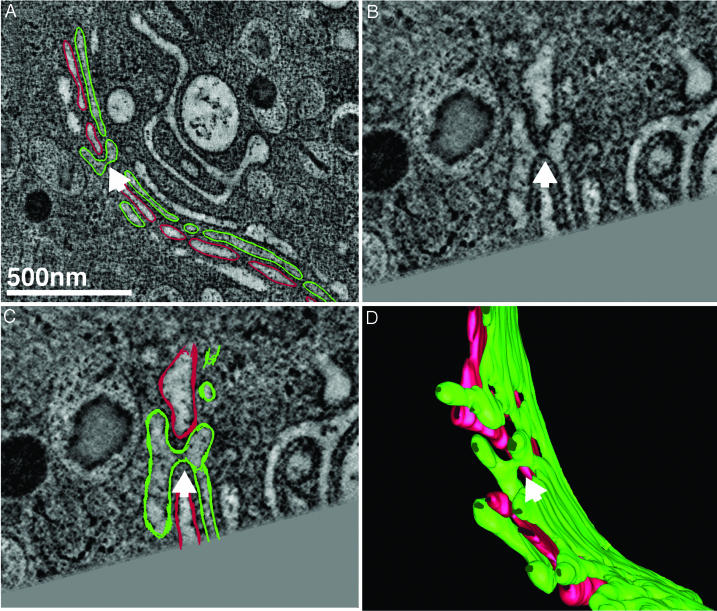
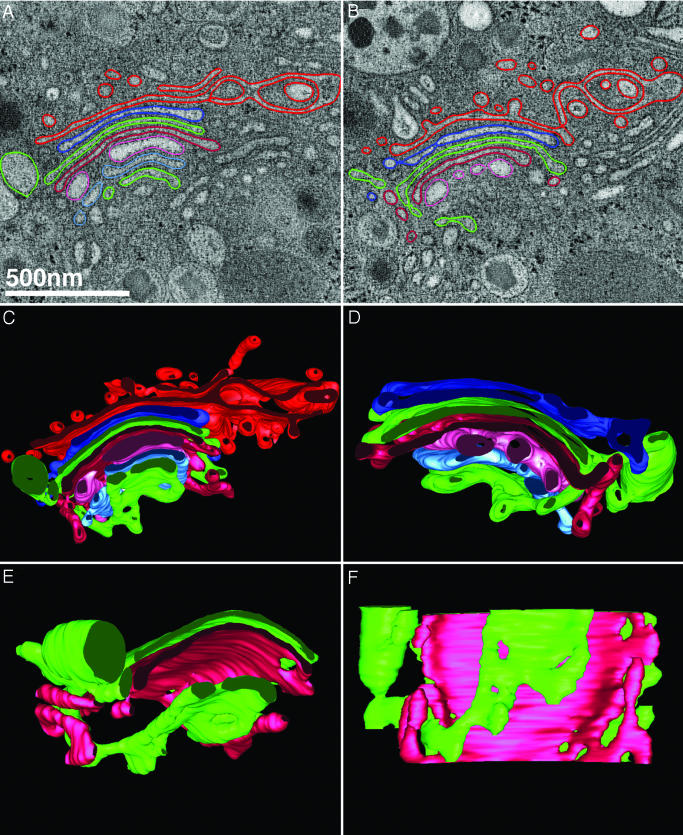
Direct continuity between the membranes of cisternae in the Golgi complex in mammalian cells rarely has been observed; when seen, its documentation has been equivocal. Here we have used dual-axis electron microscope tomography to examine the architecture of the Golgi in three dimensions at approximately 6-nm resolution in rapidly frozen, freeze-substituted murine cells that make and secrete insulin in response to glucose challenge. Our data show three types of direct connections between Golgi cisternae that are normally distinct from one another. These connections all "bypass" interceding cisternae. We propose that when pancreatic beta cells are stimulated to synthesize and secrete insulin rapidly in vivo, such connections provide a continuous lumen that facilitates the rapid transit of large amounts of newly made protein for secretion. The heterotypic fusion of cisternae, even transiently, raises important questions about the molecular mechanisms that (i) facilitate the fusion/fission of cisternal membranes and control the directionality and specificity of such events, and (ii) retain Golgi processing enzymes at specific places within individual cisternae when two cisternae at different levels in the Golgi have fused, maintaining the sequential processing hierarchy that is a hallmark of Golgi organization.


Figures

Fig. 1.
Fig. 1.
Cisternal bypass in the Golgi of glucose-stimulated islet beta cells. (A) Low magnification overview of the Golgi ribbon in a pancreatic beta cell preserved in situ in an isolated mouse islet stimulated with 11 mM glucose for 1 h. The box highlights a branched region of the ribbon shown at higher magnification in B, C, and D. Each panel represents individual (sequential but not adjacent) tomographic slices (z = 2, 9, and 21) extracted from the 103 tomographic slices (each 2.3 nm thick) that together comprise the reconstructed 3D volume. (B) The apparent trans-most cisterna (blue) and the penultimate trans-cisterna (green) stay in register where the Golgi ribbon branches. However, all cisternae in the upper stack are not directly continuous across the branch point with cisternae at equivalent levels in the lower stack. Direct continuity between alternating, nonequivalent cisternae (green) occurs laterally at the periphery of a cisternal opening (A and B). Alternate cisternae (blue) connect directly with each other through an opening or fenestration in the interceding green cisterna (arrowhead). This process is not readily apparent in a single tomographic slice and is thus displayed in two sequential slices that are ≈28 nm apart in the z axis (C and D). (E and F) Front and back views (rotated 180°) of the 3D model generated by manually segmenting (“modeling”) the tomographic data represented in AD. Both types of cisternal bypass can be seen. In E and F, the lateral continuities at the periphery of the upper stack can be followed; the arrowhead in F highlights the connection between cisternae at different levels (blue) through a fenestration or hole in the adjacent (green) cisterna. Movies 1 and 2 that show the original tomographic data (Movie 1), together with the modeled data derived from the 3D reconstructions (Movie 2), allow one to better follow and appreciate these connections. (Scale bars, 500 nm.)
Fig. 2.
Fig. 2.
Cisternal bypass through fenestration of the adjacent cisterna. (A) A low-magnification normal xy view of a pixel-thick slice extracted from a 3D reconstruction of a region of the Golgi ribbon from a glucose-stimulated islet beta cell different from that shown in Fig. 1. By using the Slicer tool that is part of the program 3dmod, we rotated the data by –19.1°, –8.4°, and –32.6° in x, y, and z, respectively, to more clearly visualize the connections both without (B) and with (C) model contours drawn. The images shown in B and C each represent the sum of three individual tomographic slices corresponding to a thickness of 6.9 nm. (C) Model contours from five tomographic slices are drawn, because the model contours are now oblique to the normal (xy) plane. (D) The 3D model generated from the tomographic slice data presented in the preceding panels is shown.
Fig. 3.
Fig. 3.
Cisternal bypass at the stack periphery where the Golgi ribbon is unbranched. An example of the third type of connection between cisternae at different levels in the Golgi of another islet beta cell following glucose-stimulation (60 ± 15 min) is shown. Neither of the two tomographic slices shown in A and B are able to convincingly demonstrate that the cisternae (green) located at the cis- and trans-sides of the stack (lower and upper faces of the stack, respectively) are directly connected to one another at the periphery of the ribbon. However, when contoured in the z axis and rendered in 3D, the tubular membrane lumen connecting each of the flattened, saccular cisternae can be followed in the context of all cisternae within the stack (C), including the clathrin-coated trans-most cisterna (red) that presents numerous vesicular and tubular profiles. (D) The same stack shown in C but viewed from behind (rotated 180°) and without the trans-most cisterna displayed. In E and F, the connected cisternae (green) are viewed from the front and from below, together with an interceding cisterna (cherry red) for perspective, to allow the reader to visualize the connecting region. In C and D, it should be noted that none of the cisternae in the Golgi stack are simply “folded over”; rather, the connection takes the form of a membrane tubule. Movies 3 and 4 of the tomogram of this region shown in A and B (Movie 3), and of the 3D model data generated by tracing membranes within the reconstructed volume shown in CF allow the interconnected cisternae to be viewed unambiguously as they are rotated around the x and y axes (Movie 4). Although vesicles are present in the Golgi regions of these cells, we have not shown them for the sake of clarity. However, discrete vesicles associated with the trans-Golgi (red) can be viewed in Movie 4.

References

    1. Jamieson, J. D. & Palade, G. E. (1966) Proc. Natl. Acad. Sci. USA 55, 424–431. - PMC - PubMed
    1. Rothman, J. E. (1994) Nature 372, 55–63. - PubMed
    1. Grassé, P. P. (1957) C. R. Acad. Sci. 245, 1278–1281. - PubMed
    1. Mollenhauer, H. H. & Whaley, W. G. (1963) J. Cell Biol. 17, 222–225. - PMC - PubMed
    1. Bonfanti, L., Mironov, A. A., Jr., Martinez-Menarguez, J. A., Martella, O., Fusella, A., Baldassarre, M., Buccione, R., Geuze, H. J., Mironov, A. A. & Luini, A. (1998) Cell 95, 993–1003. - PubMed

Publication types

LinkOut - more resources