. 2004 May;142(2):305-16.
doi: 10.1038/sj.bjp.0705755. Epub 2004 Apr 5.

Differential regulation of calcium homeostasis in adenocarcinoma cell line A549 and its Taxol-resistant subclone

Affiliations

Differential regulation of calcium homeostasis in adenocarcinoma cell line A549 and its Taxol-resistant subclone

Shanthala Padar et al. Br J Pharmacol. 2004 May.

Abstract

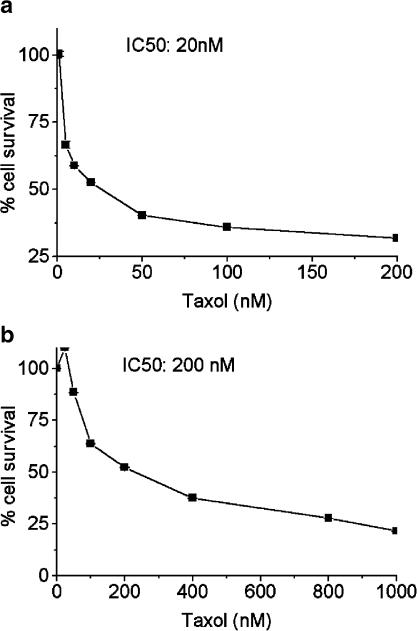
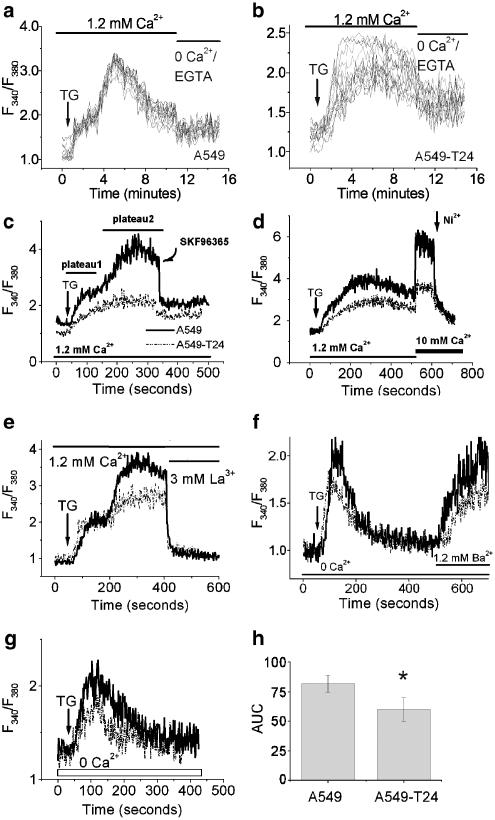
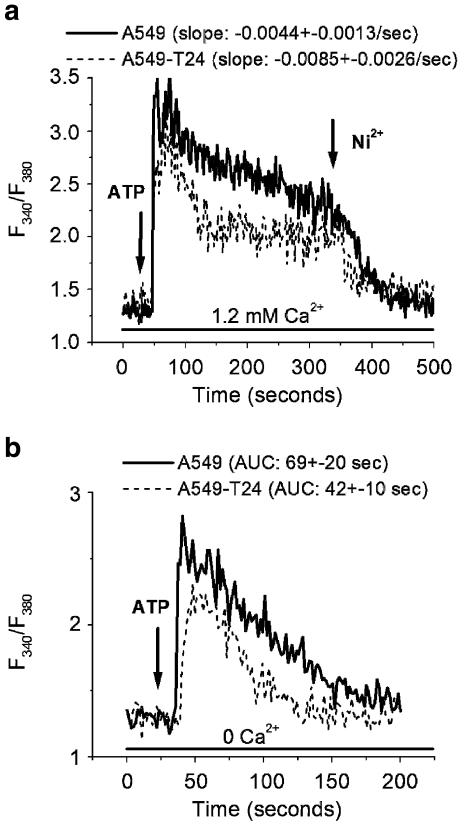
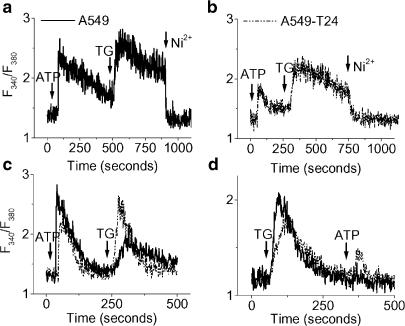
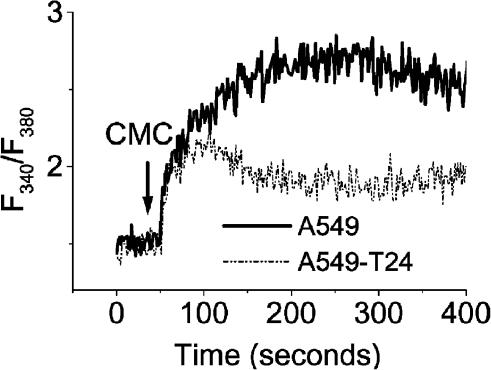
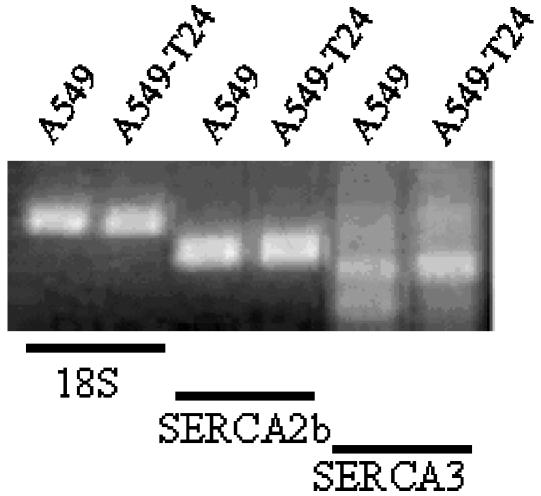
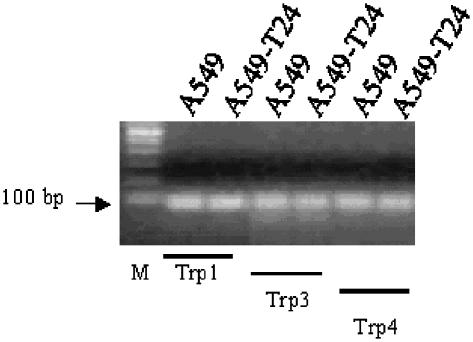
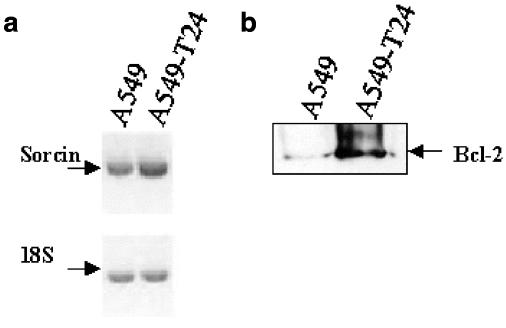
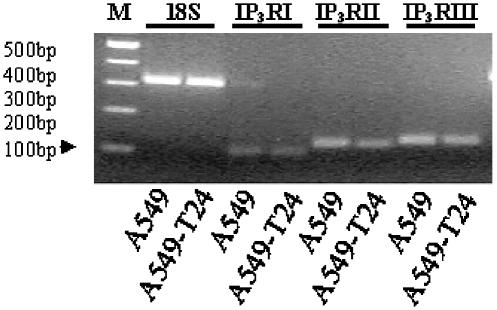
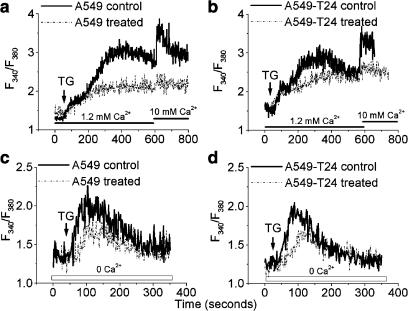
Drug resistance is a fundamental problem in cancer chemotherapy. Intracellular calcium concentration ([Ca2+](i)) may play a role in the development of chemoresistance. We investigated the regulatory role of [Ca2+](i) in Taxol resistance in the non-small-cell lung cancer cell line A549 and its chemoresistant subclone A549-T24. Measurement of cytosolic calcium ([Ca2+](c)) in single cells and cell populations revealed similar levels of basal calcium in the two cell lines. However, a reduced response to thapsigargin (a sarcoplasmic/endoplasmic reticulum Ca2+-ATPase (SERCA) inhibitor) in A549-T24 cells compared to the parent cell line suggested a lower ER Ca2+ content in these cells. mRNA expression of SERCA2b and SERCA3, major Ca2+ pumps involved in ER Ca2+ homeostasis, did not significantly differ between the two cell lines, as revealed by RT-PCR. An altered calcium influx pathway in the Taxol-resistant cell line was observed. Modulation of the ER calcium pools using CMC (4-chloro-m-cresol) and ATP revealed lower ryanodine receptor (RyR) and IP(3) receptor (IP(3)R)-sensitive Ca2+ stores in the chemoresistant cell line. Western blot and RT-PCR studies suggested that A549-T24 cells expressed higher levels of the antiapoptotic protein Bcl-2 and the calcium-binding protein sorcin, respectively, in comparison to the parent cell line. Both of these proteins have been previously implicated in chemoresistance, in part, due to their ability to modulate[Ca2+](i). These results suggest that altered intracellular calcium homeostasis may contribute to the Taxol-resistant phenotype.


Figures

Figure 1
Figure 1
Taxol induced cytotoxicity in tumor cells. The cells were seeded in 96-well plates (3 × 10³ per well) were treated with increasing concentrations of Taxol for 48 h. Cell viability was measured by the MTS assay as described in Methods. The values represent the mean cell survival±deviation from three independent experiments compared with the untreated control cells (100% survival). A 10-fold difference in the IC50 value was found between the cell lines (P<0.01, N=3). (a) A549 cells, (b) A549-T24 cells.
Figure 2
Figure 2
Fluorescent images of calcein-AM (green) and propidium iodide (red) double-stained cells. Tumor cells were grown on poly-L-lysine or Collagen IV-coated coverslips, exposed to Taxol for 48 h, and subsequently analyzed for apoptosis as described in Methods. (a) A549 control, (b) A549-T24 control, (c) A549 treated with 20 nM Taxol, (d) A549-T24 treated with 200 nM Taxol. Scale bar=25 μm.
Figure 3
Figure 3
Steady-state and agonist-induced intracellular calcium levels in tumor cells. The cells were loaded with Fura-2 AM and [Ca2+]c was detected as described in Methods. (a, b) Single-cell calcium measurements by fluorescence imaging microscopy in TG (100 nM)-treated A549 (a) and A549-T24 cells (b), followed by removal of extracellular calcium. [Ca2+]c changes were recorded in 15–20 cells. (c–e) A representative tracing of the response of [Ca2+]i of A549 and A549-T24 cells in response to TG (100 nM), followed by SKF96365 (50 μM) treatment (c), addition of extracellular calcium (10 mM) and Ni2+ (10 mM) treatment (d), or La3+ (3 mM) treatment (e). (f) A representative tracing of the response of [Ca2+]i of A549 and A549-T24 cells in response to TG (100 nM) in Ca2+-free medium, followed by addition of 1.2 mM Ba2+. (g) A representative tracing of the response of [Ca2+]i of A549 and A549-T24 cells in response to TG (100 nM) in the absence of extracellular calcium. (h) The mean±s.d. of AUC of TG (100 nM) response in the absence of extracellular Ca2+. *Significantly different (P<0.01, N=6) from A549 by Mann–Whitney test.
Figure 4
Figure 4
ATP-induced Ca2+ signals. A representative tracing of the response of [Ca2+]i of A549 and A549-T24 cells in response to ATP (100 μM) in the presence (a) and absence (b) of 1.2 mM extracellular calcium. The rate of [Ca2+]i decay upon ATP response in the presence of extracellular calcium was slower in A549 compared to A549-T24 (P<0.01, N=7). The mean±s.d. of AUC of ATP response in the absence of extracellular calcium was significantly higher in A549 compared to A549-T24 (P<0.01, N=7).
Figure 5
Figure 5
Effect of ATP pretreatment on TG-mediated Ca2+ signals. (a, b) A representative tracing of the response of [Ca2+]i of A549 (a) and A549-T24 (b) cells in response to ATP (100 μM) in the presence of 1.2 mM [Ca2+]o, followed by TG (100 nM) treatment and Ni2+ (10 mM) treatment. (c, d) Representative traces of [Ca2+]er release in A549 and A549-T24 cells in the absence of extracellular calcium. In (c), the cells were first treated with ATP (100 μM) followed by TG (100 nM). In (d), the order of addition of these agents was reversed.
Figure 6
Figure 6
RyR-mediated Ca2+ release. Representative traces of the response of [Ca2+]i of A549 and A549-T24 cells in response to CMC (500 μM) in the presence of 1.2 mM extracellular calcium.
Figure 7
Figure 7
SERCA mRNA expression in A549 and A549-T24 cells. Semi-quantitative RT–PCR analysis of SERCA2b and SERCA3 were carried out using isoform-specific primers as described in Methods. The expression level of 18S ribosomal RNA served as an internal control.
Figure 8
Figure 8
TRP mRNA expression in A549 and A549-T24 cells. Semi-quantitative RT–PCR analysis of Trp1, 3 and 4 was carried out as described in Methods. A 100-bp DNA ladder was used to estimate the size of the amplified products. M: 100 bp DNA ladder.
Figure 9
Figure 9
Expression of sorcin and Bcl-2 in A549 and A549-T24 cells. Semi-quantitative RT–PCR analysis of sorcin mRNA expression (a), and Western blot analysis of Bcl-2 (22 kDa) protein expression (b) were carried out as described in Methods. The intensities of the bands were measured by densitometry. The expression of 18S ribosomal RNA was used as an internal control. A549-T24 cells expressed significantly higher levels of sorcin mRNA (P<0.05, N=3), and Bcl-2 protein (P<0.01, N=3).
Figure 10
Figure 10
mRNA expression of IP3R type I (IP3RI), type II (IP3RII) and type III (IP3RIII) in A549 and A549-T24 cells. Semi-quantitative RT–PCR analysis of IP3RI, IP3RII and IP3RIII were carried out as described in Methods. The expression of 18S ribosomal RNA was used as an internal control. A 100-bp DNA ladder was used to estimate the size of the amplified products. M: 100 bp DNA ladder.
Figure 11
Figure 11
TG-evoked Ca2+ response in Taxol-treated cells. The tumor cells were treated with either vehicle (control, solid line) or IC50 concentrations of Taxol (treated, dotted line) for 24 h. [Ca2+]c in Fura-2-AM-loaded cells were then measured as described in Methods. (a, b) A representative tracing of the response of [Ca2+]i of A549 (a) and A549-T24 (b) cells in response to TG (100 nM) in the presence of 1.2 mM of calcium, followed by addition of extracellular calcium (10 mM). (c, d) A representative tracing of the response of [Ca2+]i of A549 (c) and A549-T24 (d) cells in response to TG (100 nM) in the absence of extracellular calcium.

Similar articles

Cited by

References

    1. BENNETT D.L., BOOTMAN M.D., BERRIDGE M.J., CHEEK T.R. Ca2+ entry into PC12 cells initiated by ryanodine receptors or inositol 1,4,5-trisphosphate receptors. Biochem. J. 1998;329:349–357. - PMC - PubMed
    1. BERRIDGE M.J., LIPP P., BOOTMAN M.D. The versatility and universality of calcium signalling. Nat. Rev. Mol. Cell. Biol. 2000;1:11–21. - PubMed
    1. BISWAS R.S., CHA H.J., HARDWICK J.M., SRIVASTAVA R.K. Inhibition of drug-induced Fas ligand transcription and apoptosis by Bcl-XL. Mol. Cell Biochem. 2001;225:7–20. - PubMed
    1. BLAGOSKLONNY M.V., FOJO T. Molecular effects of paclitaxel: myths and reality (a critical review) Int. J. Cancer. 1999;83:151–156. - PubMed
    1. BROUGH G.H., WU S., CIOFFI D., MOORE T.M., LI M., DEAN N., STEVENS T. Contribution of endogenously expressed Trp1 to a Ca2+-selective, store-operated Ca2+ entry pathway. Faseb. J. 2001;15:1727–1738. - PubMed

Publication types

LinkOut - more resources