. 2004 Mar;113(6):814-25.
doi: 10.1172/JCI20083.

Mutation of hepatocyte nuclear factor-1beta inhibits Pkhd1 gene expression and produces renal cysts in mice

Affiliations

Mutation of hepatocyte nuclear factor-1beta inhibits Pkhd1 gene expression and produces renal cysts in mice

Thomas Hiesberger et al. J Clin Invest. 2004 Mar.

Abstract

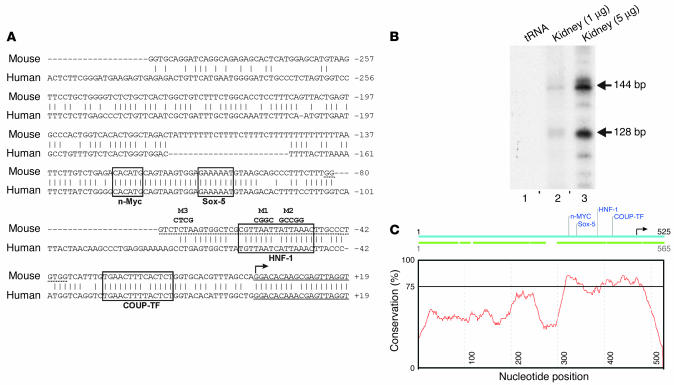
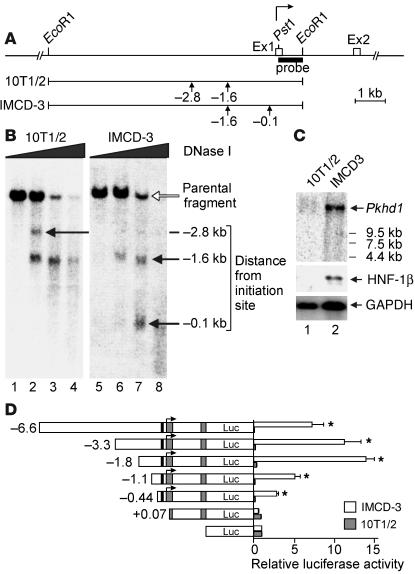
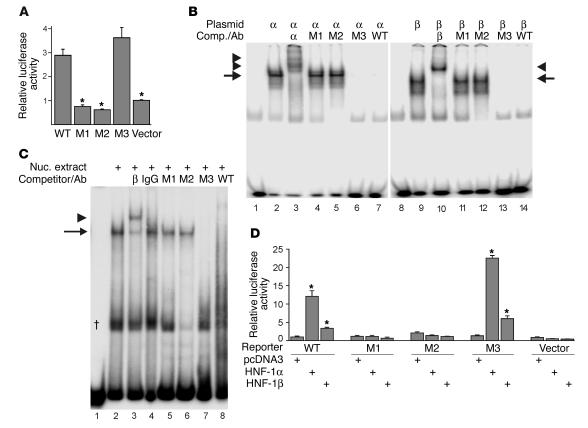
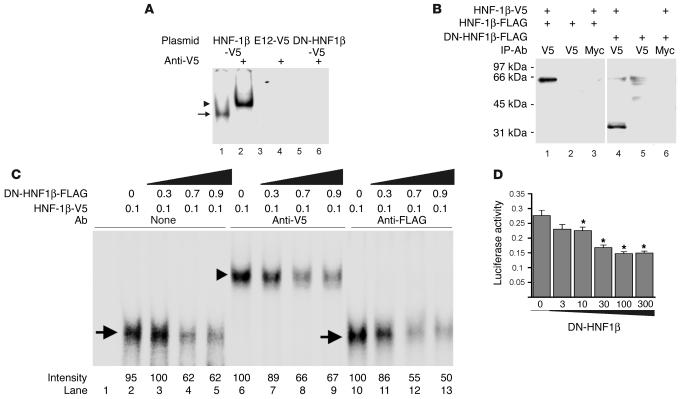
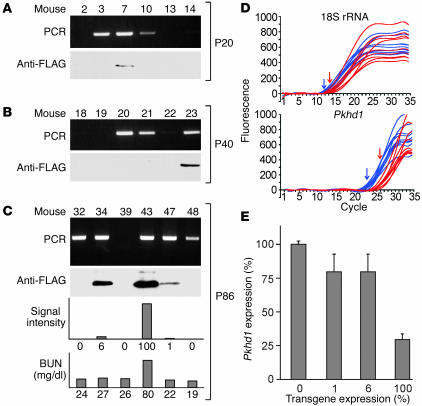
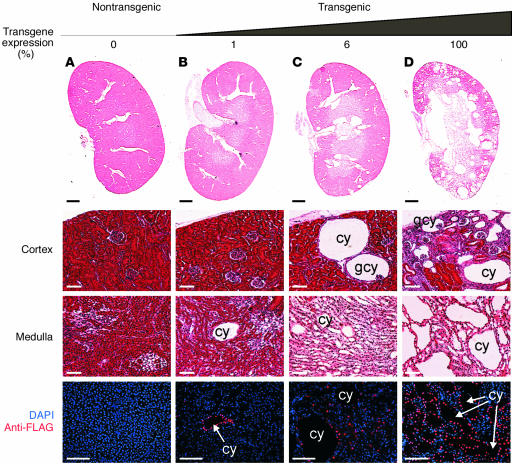
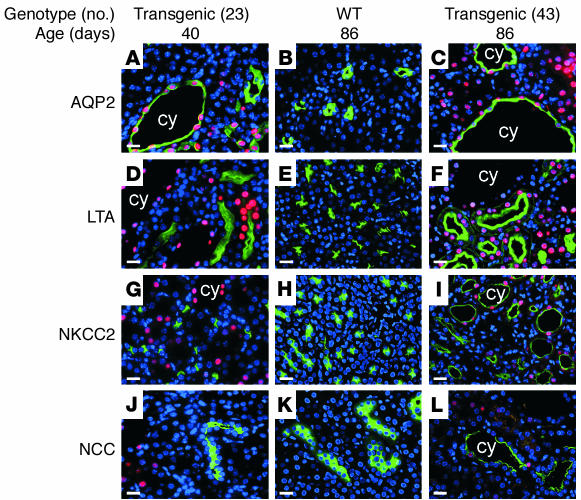
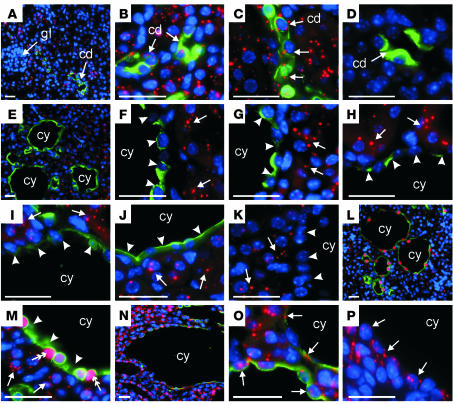
Hepatocyte nuclear factor-1beta (HNF-1beta) is a Pit-1, Oct-1/2, UNC-86 (POU)/homeodomain-containing transcription factor that regulates tissue-specific gene expression in the liver, kidney, and other organs. Humans with autosomal dominant mutations of HNF-1beta develop maturity-onset diabetes of the young type 5 (MODY5) and congenital cystic abnormalities of the kidney. Autosomal recessive polycystic kidney disease (ARPKD) is an inherited cystic disorder that produces renal failure in infants and children and is caused by mutations of PKHD1. The proximal promoter of the mouse Pkhd1 gene contains an evolutionarily conserved HNF-1-binding site that is located near a region of deoxyribonuclease hypersensitivity. HNF-1beta and the structurally related HNF-1alpha bind specifically to the Pkhd1 promoter and stimulate gene transcription. Mutations of the HNF-1 site or expression of a dominant-negative HNF-1beta mutant inhibit Pkhd1 promoter activity in transfected cells. Transgenic mice expressing a dominant-negative HNF-1beta mutant under the control of a kidney-specific promoter develop renal cysts, similarly to humans with MODY5. Pkhd1 transcripts are absent in the cells lining the cysts but are present in morphologically normal surrounding tubules. These studies identify a link between two cystic disease genes, HNF1beta (MODY5) and PKHD1 (ARPKD). HNF-1beta directly regulates the transcription of Pkhd1, and inhibition of PKHD1 gene expression may contribute to the formation of renal cysts in humans with MODY5.


Figures

Figure 1
Figure 1
Sequence of the Pkhd1 promoter. (A) Alignment of the mouse (upper) and human (lower) Pkhd1 promoters. Short vertical line indicates identity. Dash indicates gaps introduced to optimize the alignment. Bent arrow indicates the transcription initiation site at +1. Solid underlines indicate exon 1. Dashed underlines indicate the DNA fragment used for EMSA. Boxes indicate evolutionarily conserved transcription factor–binding sites identified using the ConSite program (conservation 75%, window 50, transcription factor threshold 80%). Nucleotides in bold type indicate the site-directed mutations M1–M3. The sequence of the mouse Pkhd1 promoter has been deposited in the GenBank database (accession number AY544205). (B) Mapping of the transcription initiation site by primer extension. Arrows indicate products corresponding to transcription initiation sites at +1 (144 bp) and +17 (128 bp) in kidney RNA (lanes 2 and 3) but not in yeast tRNA (lane 1). (C) Plot of the percentage of identity between the mouse (blue) and human (green) promoters. Horizontal line indicates 75% identity.
Figure 2
Figure 2
DNase hypersensitive site mapping and deletion analysis of the mouse Pkhd1 promoter. (A) Structure of the 5′ end of the Pkhd1 gene. Boxes indicate exons. Bent arrow indicates the transcription initiation site at +1. Bar indicates the 3′ probe used for indirect end labeling. Vertical arrows indicate hypersensitive sites. (B) Southern blot of genomic DNA from mIMCD-3 cells (right) and 10T1/2 cells (left) after digestion with graded concentrations of DNase I. Open arrow indicates the parental 8.1-kb EcoRI fragment. Closed arrows indicate sub-bands corresponding to hypersensitive sites located at the positions indicated on the right. (C) Northern blot showing endogenous expression of Pkhd1 (upper panel) and HNF-1β (middle panel) in mIMCD-3 cells (lane 2) and absence of expression in 10T1/2 cells (lane 1). Lower panel shows expression of GAPDH as a loading control. (D) Deletion analysis of the Pkhd1 promoter. Left panel shows plasmids containing fragments of the Pkhd1 promoter linked to a promoterless luciferase (Luc) reporter gene. Bent arrow indicates the transcription initiation site at +1, gray boxes indicate exons, and black boxes indicate the consensus HNF-1 site. Right panel shows luciferase activity in transfected mIMCD-3 cells (white bars) and 10T1/2 cells (gray bars). Data are presented as mean ± SE of six to nine independent transfections. *P < 0.05 compared with empty pGL3-Basic.
Figure 3
Figure 3
Mutational analysis of the Pkhd1 promoter and binding of HNF-1. (A) Luciferase activity in mIMCD-3 cells transfected with reporter plasmids containing the WT 444-bp Pkhd1 promoter (WT), mutated promoter (M1–M3), or empty pGL3-Basic (Vector). Data are presented as mean ± SE of nine independent transfections. *P < 0.01 compared with WT promoter. (B) EMSA performed with a 44-bp DNA fragment containing the consensus HNF-1 site and reticulocyte lysates programmed with HNF-1α (lanes 2–7), HNF-1β (lanes 9–14), or unprogrammed lysates (lanes 1 and 8). Binding reactions were performed in the presence of anti–HNF-1α Ab (lane 3), anti–HNF-1β Ab (lane 10), or 100-fold excess unlabeled competitor (Comp.) DNA fragment (lanes 4–7, 11–14). (C) EMSA performed using the 44-bp DNA fragment and nuclear (Nuc) extracts from mIMCD-3 cells (lanes 2–8) or no protein (lane 1). Binding reactions were performed in the presence of anti–HNF-1β Ab (lane 3), irrelevant Ab (lanes 4), or 100-fold excess unlabeled DNA fragment (lanes 5–8). In B and C, arrows indicate retarded band, and arrowheads indicate supershifted band. †Complex that does not contain HNF-1β. (D) Luciferase activity in HeLa cells cotransfected with reporter plasmids containing the WT 444-bp Pkhd1 promoter (WT), mutated promoter (M1–M3), or empty pGL3-Basic (Vector) and expression plasmids encoding HNF-1α, HNF-1β, or empty pcDNA3. Data are presented as mean ±SE of six independent transfections. *P < 0.01 compared with cells cotransfected with empty expression plasmid.
Figure 4
Figure 4
Effects of DN-HNF1β on DNA binding and promoter activity. (A) EMSA performed using a 44-bp DNA fragment containing the consensus HNF-1 site and nuclear extracts from HeLa cells transfected with expression plasmids encoding V5-tagged HNF-1β (lanes 1 and 2), E12 (lanes 3 and 4), or DN-HNF1β (lanes 5 and 6). Binding reactions were performed in the presence of anti-V5 Ab (lanes 2, 4, and 6) or no Ab (lanes 1, 3, and 5). Arrow indicates retarded band, and arrowhead indicates supershifted band. (B) HEK293 cells were transfected with plasmids encoding FLAG-tagged HNF-1β (lanes 1–3), V5-tagged HNF-1β (lanes 1, 3, 4, and 6), or FLAG-tagged DN-HNF1β (lanes 4–6). Cell lysates were immunoprecipitated (IP) with anti-V5 Ab (lanes 1, 2, 4, and 5) or anti-Myc Ab (lanes 3 and 6), and the immune complexes were subjected to immunoblot analysis with HRP-conjugated anti-FLAG Ab. (C) EMSA performed with the 44-bp DNA fragment and reticulocyte lysates programmed with the indicated amounts (nanograms) of plasmids encoding V5-tagged HNF-1β or FLAG-tagged DN-HNF1β. Binding reactions were performed in the presence of anti-V5 Ab (lanes 6–9), anti-FLAG Ab (lanes 10–13), or no Ab (lanes 1–5). Arrow indicates retarded band, and arrowhead indicates supershifted band. (D) Luciferase activity in mIMCD-3 cells cotransfected with a reporter plasmid containing the 444-bp Pkhd1 promoter and the indicated amounts (nanograms) of an expression plasmid encoding DN-HNF1β. Data presented are mean ± SE of nine independent transfections. *P < 0.05 compared with cells transfected with empty expression plasmid.
Figure 5
Figure 5
Analysis of DN-HNF1β transgenic mice. (A–C) PCR analysis of tail biopsies (upper panels) and immunoblot analysis of kidney extracts (second panels) from mice sacrificed at P20 (A), P40 (B), or P86 (C). Lower panels in C show immunoblot signal intensity (expressed as percentage of the highest expression observed) and BUN in mice at P86. (D) Real-time RT-PCR tracings of Pkhd1 RNA and 18S rRNA in a transgenic mouse (red) and nontransgenic littermate (blue). Arrows indicate threshold cycles. (E) Pkhd1 RNA expression (percentage of WT) in four independent founders expressing the indicated amounts of DN-HNF1β mutant (percentage of highest expression). Data presented are mean ±SE of three separate measurements.
Figure 6
Figure 6
Formation of renal cysts in DN-HNF1β transgenic mice. (A–D) H&E-stained kidney sections from three P86 transgenic mice expressing the indicated amounts of the DN-HNF1β mutant (percentage of highest expression) and a nontransgenic littermate (A). Middle panels show higher magnification images of the renal cortex and medulla. Lower panels show localization of the DN-HNF1β mutant with an anti-FLAG Ab (red). Nuclei were counterstained with DAPI (blue). cy, cyst; gcy, glomerular cyst. Bars, 1 mm (top row), 50 μm (bottom three rows).
Figure 7
Figure 7
Origins of renal cysts in DN-HNF1β transgenic mice. Kidney sections from transgenic mice at P40 (A, D, G, J) and P86 (C, F, I, L) and a nontransgenic littermate (B, E, H, K) costained with anti-FLAG Ab (red) and Ab’s to AQP2 (A–C), NKCC2 (G–I), NCC (J–L), or FITC-coupled LTA (D–F) (green). Nuclei were counterstained with DAPI (blue). cy, cyst. Bar, 10 μm.
Figure 8
Figure 8
Inhibition of Pkhd1 expression in renal cysts of DN-HNF1β transgenic mice. (A–P) Fluorescence in situ hybridization of Pkhd1 antisense riboprobes (red) and (A–J, L–O) costaining with anti-AQP2 Ab (green) in kidney sections. (A–C) Nontransgenic mice show Pkhd1 expression in collecting duct (cd) (arrows) and absence in glomeruli (gl). (D) Hybridization to a sense riboprobe produces no significant signal. (E–K) Five independent DN-HNF1β transgenic founders, no. 23 (E and F), no. 7 (G), no. 43 (H), no. 47 (I), and no. 34 (J and K), show absence of Pkhd1 RNA expression (arrowheads) in the cells lining the renal cysts (cy). Arrows indicate expression in surrounding noncystic tubules. (L and M) Costaining of transgenic founder no. 23 with an anti-FLAG Ab (red) shows the absence of Pkhd1 RNA in the cytosol (arrowheads) of cyst epithelial cells in which the DN-HNF1β mutant was expressed in the nucleus (double arrow). Arrows indicate Pkhd1 expression in surrounding tubules that do not express the DN-HNF1β mutant. (N–P) Kidney-specific Kif3a KO mice show expression of Pkhd1 in the cells lining the renal cysts (arrows) as well as in surrounding tubules. (K and P) Costaining with anti-AQP2 was omitted to more clearly show the absence of Pkhd1 transcripts (arrowheads) in the cyst epithelial cells of DN-HNF1β transgenic mice (K) and the expression of Pkhd1 (arrows) in the cyst epithelial cells of Kif3a KO mice (P). Nuclei were counterstained with DAPI (blue). Bars, 20 μm.

Similar articles

Cited by

References

    1. Pontoglio M. Hepatocyte nuclear factor 1, a transcription factor at the crossroads of glucose homeostasis. J. Am. Soc. Nephrol. 2000;11(Suppl. 16):S140–S143. - PubMed
    1. Mendel DB, Hansen LP, Graves MK, Conley PB, Crabtree GR. HNF-1α and HNF-1β (vHNF-1) share dimerization and homeo domains, but not activation domains, and form heterodimers in vitro. Genes Dev. 1991;5:1042–1056. - PubMed
    1. Baumhueter S, Courtois G, Crabtree GR. A variant nuclear protein in dedifferentiated hepatoma cells binds to the same functional sequences in the β fibrinogen gene promoter as HNF-1. EMBO J. 1988;7:2485–2493. - PMC - PubMed
    1. Barbacci E, et al. Variant hepatocyte nuclear factor 1 is required for visceral endoderm specification. Development. 1999;126:4795–4805. - PubMed
    1. Coffinier C, Barra J, Babinet C, Yaniv M. Expression of the vHNF1/HNF1β homeoprotein gene during mouse organogenesis. Mech. Dev. 1999;89:211–213. - PubMed

Publication types

MeSH terms