. 2004 Mar;113(6):826-35.
doi: 10.1172/JCI20096.

Dysregulated LIGHT expression on T cells mediates intestinal inflammation and contributes to IgA nephropathy

Affiliations

Dysregulated LIGHT expression on T cells mediates intestinal inflammation and contributes to IgA nephropathy

Jing Wang et al. J Clin Invest. 2004 Mar.

Abstract

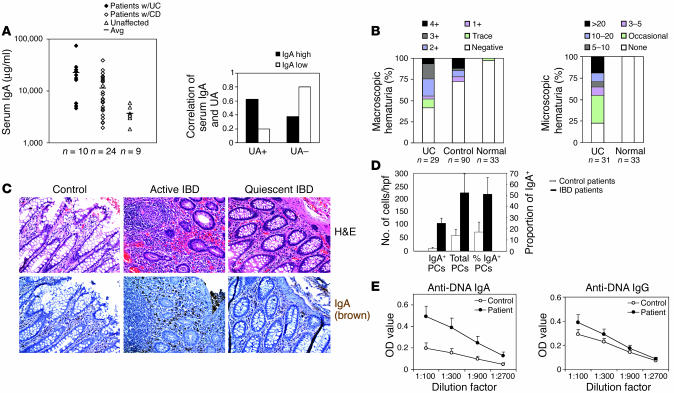
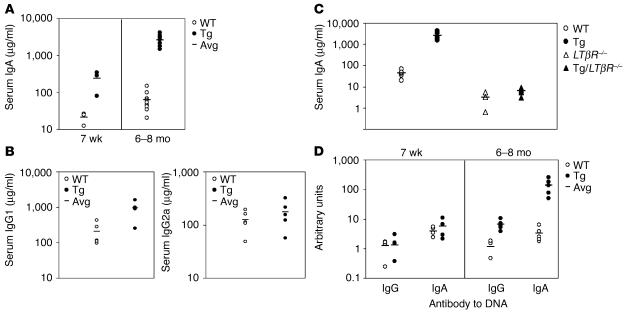
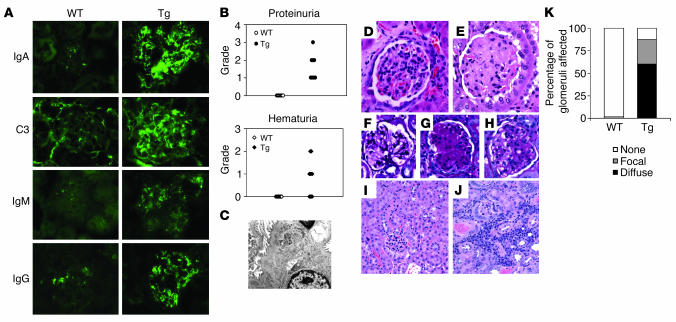
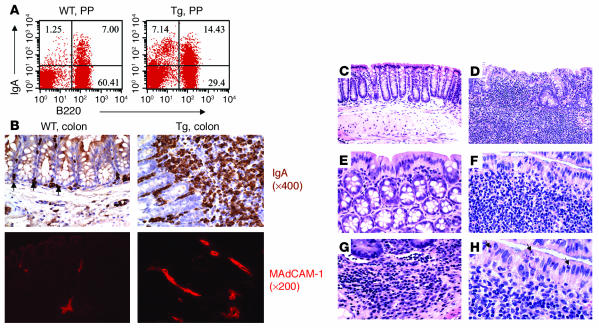
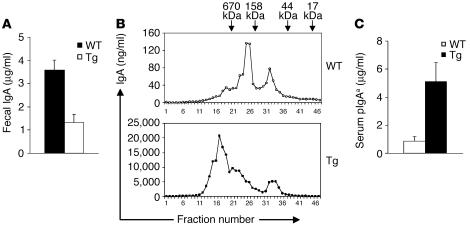
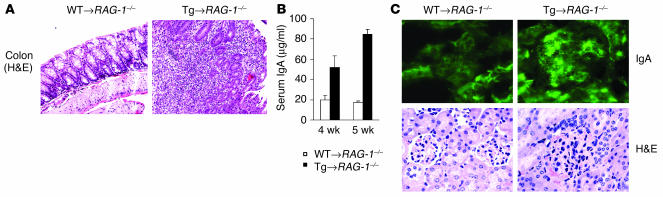
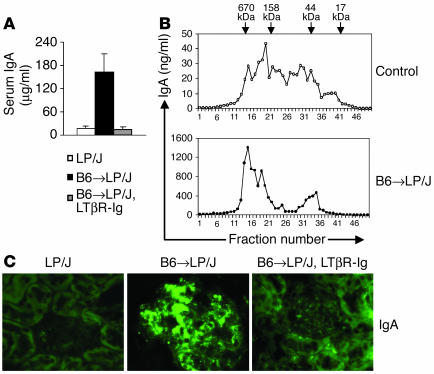
Whether and how T cells contribute to the pathogenesis of immunoglobulin A nephropathy (IgAN) has not been well defined. Here, we explore a murine model that spontaneously develops T cell-mediated intestinal inflammation accompanied by pathological features similar to those of human IgAN. Intestinal inflammation mediated by LIGHT, a ligand for lymphotoxin beta receptor (LTbetaR), not only stimulates IgA overproduction in the gut but also results in defective IgA transportation into the gut lumen, causing a dramatic increase in serum polymeric IgA. Engagement of LTbetaR by LIGHT is essential for both intestinal inflammation and hyperserum IgA syndrome in our LIGHT transgenic model. Impressively, the majority of patients with inflammatory bowel disease showed increased IgA-producing cells in the gut, elevated serum IgA levels, and severe hematuria, a hallmark of IgAN. These observations indicate the critical contributions of dysregulated LIGHT expression and intestinal inflammation to the pathogenesis of IgAN.


Figures

Figure 1
Figure 1
IBD patients show upregulated serum IgA levels and enhanced incidence of abnormal UAs. (A) Comparison of serum IgA in patents with ulcerative colitis (w/UC; n = 10) or Crohn disease (w/CD; n = 24) and unaffected control subjects (Unaffected; n = 9) by ELISA illustrates the increase in serum IgA in IBD patients (left panel). Avg, average. Higher serum IgA levels correlate with a positive UA in IBD patients (right panel: UC, n = 9; CD, n = 17). UA+, trace to 4+. (B) Macroscopic and microscopic UAs show the remarkable increase in hematuria in IBD patients (UC) compared with unselected patients (Control) or normal individuals (Normal) at the same hospital. (C) Immunohistochemical staining demonstrates increased IgA+ PCs in the intestine of active IBD patients (Active IBD), while the quiescent IBD patients (Quiescent IBD) or control patients show much less positive staining for IgA (n = 3 per group). Severe intestinal inflammation was observed in active IBD patients but not in quiescent or control patients (n = 3; H&E). Magnification, ×200. (D) PCs and IgA-PCs in LP were counted using a microscope. The numbers of PCs and IgA-PCs in active IBD patients were dramatically increased compared with those of controls. Cells in ten high-power fields (hpf’s) were counted for each control or patient, and three controls or patients were analyzed. (E) Anti-DNA IgG and IgA antibodies were tested in controls (n = 5) and patients (n = 6). Data are means ± SE of OD values.
Figure 2
Figure 2
Elevated serum IgA and IgA deposition in the kidneys of Tg mice. (A) Sera were collected from WT and Tg mice at the age of 6–8 months (right) or 7 weeks (left) and were subjected to IgA ELISA. Right, the level of serum IgA was dramatically enhanced in aged Tg mice (n = 10). Left, the level of serum IgA was increased up to tenfold in Tg mice (n = 4 per group). (B) Sera were collected from WT and Tg mice 6–8 months of age and were subjected to IgG1 and IgG2a ELISA (n = 5). Open circles, WT; filled circles, Tg. (C) LIGHT Tg mice were crossed with LTβR–/– mice. Sera were collected from LTβR–/– and Tg/LTβR–/– mice 6–8 months of age and IgA levels were determined by ELISA (n = 5). Hyperserum IgA was absent in Tg/LTβR–/– mice compared with Tg mice. (D) Anti-DNA antibody was examined in WT and Tg mice (n = 5 per group). Anti-DNA IgG and anti-DNA IgA were both increased in aged Tg mice (6–8 months old), while there was no increase in young Tg mice (7 weeks old).
Figure 3
Figure 3
Dominant IgA deposition and abnormal UA in Tg mice. (A) Immunofluorescence staining of kidney sections of WT (left) and Tg (right) mice 6–8 months of age. Distinct IgA, C3, IgM, and IgG deposition were observed in aged Tg mice. Representative data are shown (n = 3). Magnification, ×630. (B) Urine samples were subjected to strip UA. The incidence and severity of proteinuria (n = 10) and hematuria (n = 10) were higher in aged Tg mice (filled symbols) than in WT mice (open symbols). (C) EM analysis of Tg glomeruli, showing mesangial deposition of immunoglobulin. (D and E) WT normal glomerulus (D) (H&E; magnification, ×400) and Tg glomerulus with significant mesangial expansion with acellular eosinophilic material (E) (H&E; magnification, ×400). (F–H) WT normal glomerulus (F) (PAS; magnification, ×400), and Tg glomerulus (G and H) with diffuse (G) and focal (H, right half of glomerulus) deposition of PAS-stainable material in the glomerular matrix. (I and J) WT tubulointerstium with no significant inflammatory cellular infiltrate (I), and Tg tubulointerstium with patchy collections of inflammatory cellular infiltrates (J) (H&E; magnification, ×200). (K) Semiquantitative assessment of the degree and severity of glomerular lesions in WT and Tg mice (n = 4 mice per group).
Figure 4
Figure 4
Increase in IgA+ cells in PPs and colon. (A) The frequency of IgA+ and B220+ IgA+ cells in PPs. Representative FACS profiles of IgA and B220 staining of WT (left) and Tg (right) PP cells from mice 6–8 months of age are shown. IgA+ and B220+IgA+ cells were increased in PPs of Tg mice (n = 4). (B) Immunohistochemical staining of intestine for IgA+ PCs (indicated by arrows) in WT and Tg mice (top panels). Magnification, ×400. Upregulation of MAdCAM-1 expression in Tg intestine (bottom panels). Intestine sections were stained with anti–MAdCAM-1 and subjected to fluorescence microscopy. Representative pictures are shown for WT and Tg mice 6–8 months of age (n = 3). Magnification, ×200. (C–H) H&E staining for WT (C and E) or Tg (D, F–H) intestine, showing a dramatic infiltration of inflammatory cells in Tg mice. In Tg intestine, there were increases in PCs (G) and apoptosis of epithelial cells (H, arrow). Magnifications: ×200 (C and D), ×400 (E–G), and ×1,000 (H).
Figure 5
Figure 5
Defective IgA transportation and polymeric nature of serum IgA. (A) Feces of mice 8–10 months of age were collected, and IgA levels in the fecal extracts were determined by ELISA. Fecal IgA levels in Tg mice decreased significantly. Data are mean values ± SE from five mice per group. Student’s t test was used to compare the values between the WT and Tg groups: P < 0.05. (B) FPLC fraction profiles of IgA in sera. Gel-filtration molecular mass marker for protein was used. IgA levels in fractioned samples of sera were determined by ELISA. pIgA is predominant in sera of Tg mice compared with WT mice 6–8 months old. (C) After pIgA was purified from serum of Igha mice, it was administered i.v. to WT or Tg mice 8–10 months of age (n = 5). The level of pIgAa was tested by ELISA against IgAa. Tg recipients showed much higher levels of pIgAa.
Figure 6
Figure 6
Recapitulation of IBD and IgAN in RAG-1–/– mice with adoptively transferred Tg LN cells. (A–C) LN cells from WT or Tg mice 2–3 months of age were transferred into RAG-1–/– mice 6–7 weeks old (6 × 10⁶ cells/mouse; n = 4). (A) Disease progression was monitored. More severe intestinal inflammation was seen in Tg recipients (right panel) than in WT recipients (left panel). (B) Serum IgA was measured by ELISA 4 or 5 weeks after transfer. Serum IgA in Tg recipients (black bars) was elevated compared with that of WT recipients (white bars). (C) Top, kidney sections from WT recipients (left) and Tg recipients (right) were subjected to IgA immunofluorescence staining. Magnification, ×630. Bottom, H&E staining of kidney sections from WT (left) or Tg (right) recipients shows the obliterated glomeruli and glomerular mesangial matrix deposition in Tg recipients.
Figure 7
Figure 7
The connection between hyperserum IgA and IgA deposition in an activated T cell–mediated model. (A–C) BM cells (2 × 10⁶) and splenocytes (5 × 10⁷) from B6 donors were transferred i.v. into MiHC-incompatible LP/J recipients. Serum was collected 20 days after transfer from control mice (LP/J), B6 → LP/J mice, and B6 → LP/J mice treated with LTβR-Ig (n = 3 per group). (A) IgA ELISA was performed. (B) FPLC fraction profiles of IgA in sera of the control and B6 → LP/J groups. Gel-filtration molecular mass marker for protein was used. IgA levels in fractioned samples from sera were determined by ELISA. pIgA is predominant in sera of the B6 → LP/J group compared with control. (C) Kidney sections were subjected to immunofluorescence staining for IgA. Representative data are shown. Magnification, ×630.

Similar articles

Cited by

References

    1. Gardby E, Lane P, Lycke NY. Requirements for B7-CD28 costimulation in mucosal IgA responses: paradoxes observed in CTLA4-H γ 1 transgenic mice. J. Immunol. 1998;161:49–59. - PubMed
    1. Vajdy M, Kosco-Vilbois MH, Kopf M, Kohler G, Lycke N. Impaired mucosal immune responses in interleukin 4-targeted mice. J. Exp. Med. 1995;181:41–53. - PubMed
    1. Hornquist CE, Ekman L, Grdic KD, Schon K, Lycke NY. Paradoxical IgA immunity in CD4-deficient mice. Lack of cholera toxin-specific protective immunity despite normal gut mucosal IgA differentiation. J. Immunol. 1995;155:2877–2887. - PubMed
    1. Lycke N, Eriksen L, Holmgren J. Protection against cholera toxin after oral immunization is thymus-dependent and associated with intestinal production of neutralizing IgA antitoxin. Scand. J. Immunol. 1987;25:413–419. - PubMed
    1. Craig SW, Cebra JJ. Peyer’s patches: an enriched source of precursors for IgA-producing immunocytes in the rabbit. J. Exp. Med. 1971;134:188–200. - PMC - PubMed

Publication types

MeSH terms