. 2004 Mar;113(6):836-45.
doi: 10.1172/JCI19442.

Blockade of T cell costimulation reveals interrelated actions of CD4+ and CD8+ T cells in control of SIV replication

Affiliations

Blockade of T cell costimulation reveals interrelated actions of CD4+ and CD8+ T cells in control of SIV replication

David A Garber et al. J Clin Invest. 2004 Mar.

Abstract

In vivo blockade of CD28 and CD40 T cell costimulation pathways during acute simian immunodeficiency virus (SIV) infection of rhesus macaques was performed to assess the relative contributions of CD4+ T cells, CD8+ T cells, and Ab responses in modulating SIV replication and disease progression. Transient administration of CTLA4-Ig and anti-CD40L mAb to SIV-infected rhesus macaques resulted in dramatic inhibition of the generation of both SIV-specific cellular and humoral immune responses. Acute levels of proliferating CD8+ T cells were associated with early control of SIV viremia but did not predict ensuing set point viremia or survival. The level of in vivo CD4+ T cell proliferation during acute SIV infection correlated with concomitant peak levels of SIV plasma viremia, whereas measures of in vivo CD4+ T cell proliferation that extended into chronic infection correlated with lower SIV viral load and increased survival. These results suggest that proliferating CD4+ T cells function both as sources of virus production and as antiviral effectors and that increased levels of CD4+ T cell proliferation during SIV infections reflect antigen-driven antiviral responses rather than a compensatory homeostatic response. These results highlight the interrelated actions of CD4+ and CD8+ T cell responses in vivo that modulate SIV replication and pathogenesis.


Figures

Figure 1
Figure 1
Effects of CS blockade on SIV replication. (A) SIV viral load (log10 SIV RNA copies per milliliter plasma) from macaques in the control group (left panel) or CS blockade treatment group (right panel). Indicated are times at which individual macaques were sacrificed because of clinical deterioration due to simian AIDS (circled x). Control macaques: ROz5 (black), RBm6 (blue), RVy5 (red), RYt5 (green). CS blockade macaques: REp6 (black), REo6 (blue), RIc6 (red), RCr5 (green). The gray bar denotes the treatment period. (B) Geometric mean SIV viral load (log10 SIV RNA copies per milliliter plasma) for CS blockade group (red) and control group (black). The yellow shading indicates times at which significant differences were determined between groups (P ≤ 0.05, repeated measures analysis of means). The gray bar denotes the treatment period.
Figure 2
Figure 2
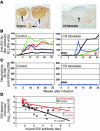
CS blockade attenuates the generation and in vivo CTL activity of SIV-specific CD8+ T cell responses. (A) Levels of Gag181–189-specific (CTPYDINQM-specific) CD8+ T cells (red trace), Tat28–35-specific (STPESANL-specific) CD8+ T cells (yellow trace), or the sum of Gag181–189- and Tat28–35-specific CD8+ T cells (blue trace) as percentages of CD8+ T cells in peripheral blood (left axes) and the level of the sum of Gag181–189- and Tat28–35-specific CD8+ T cells as a percentage of CD8+Ki67+ T cells (black trace) in peripheral blood (right axes). Left column, control macaques; right column, CS blockade macaques. Gray bars denote the treatment period. (B) Levels (%) of peripheral blood CD8+ T cells that exhibit the Ki67 antigen, a marker of cellular proliferation, by flow cytometry. Control macaques: ROz5 (black), RBm6 (blue), RVy5 (red), RYt5 (green). CS blockade macaques: REp6 (black), REo6 (blue), RIc6 (red), RCr5 (green). The gray bar denotes the treatment period. (C) Nucleotide sequences of cDNA clones encoding SIV tat exon 1 were determined at the indicated times after infection and were compared to the WT parental SIVmac239 sequence. Frequencies of cDNA clones that exhibited one or more nonsynonymous mutations within the region encoding the Tat28–35 (STPESANL) epitope are shown for individual macaques in the control or CS blockade groups. (D) Correlation of the level of Tat28–35-specific (STPESANL-specific) CD8+ T cells and the frequency of mutation within the Tat28–35 coding region at 20 days following SIV infection. The P value was determined by the Spearman rank correlation test. Control macaques (circles): ROz5 (black), RBm6 (blue), RVy5 (red), RYt5 (green); CS blockade macaques (triangles): REp6 (black), REo6 (blue), RIc6 (red), RCr5 (green).
Figure 3
Figure 3
Reduction of acute SIV viral load is directly related to CD8+ T cell proliferative responses. Correlation of the magnitude of postpeak decline in SIV viremia and Gag181–189-specific (A), Tat28–35-specific (B), and Ki67+ (C) CD8+ T cells. The magnitude of the postpeak decline in SIV viremia is reported as the logarithm of the fold reduction of SIV viremia between peak and day 27 after infection (last day of treatment). All CD8+ T cell parameters were calculated as AUCs from baseline through day 27 after infection. Control macaques (circles): ROz5 (black), RBm6 (blue), RVy5 (red), RYt5 (green); CS blockade macaques (triangles): REp6 (black), REo6 (blue), RIc6 (red), RCr5 (green). P and ρ values were determined by the Spearman rank correlation test. The solid lines are regression lines.
Figure 4
Figure 4
Chronic SIV-specific CD8+ T cell responses are impaired following acute CS blockade. Levels of Gag181–189-specific (CTPYDINQM-specific) CD8+ T cells determined by tetramer staining of peripheral blood at 20 weeks following SIV infection (A) and corresponding ELISPOT quantification of IFN-γ–producing cells following in vitro stimulation of PBMCs with Gag181–189 (CTPYDINQM) peptide (B).
Figure 5
Figure 5
Effects of acute CS blockade on humoral immune responses. (A) B cell germinal centers (arrows) in representative lymph node sections from macaques in control or treatment (CS blockade) groups at 10 days following SIV infection. Ki67+ lymphocytes are brown; magnification ×200. (B and C) SIV-specific Ab titers were determined by ELISA (B) or SIVmac239-neutralization assay (C) on plasma samples from control macaques (circles): ROz5 (black), RBm6 (blue), Rvy5 (red), RYt5 (green); or CS blockade macaques (triangles): REp6 (black), REo6 (blue), RIc6 (red), RCr5 (green). Gray bars denote the treatment period; note different scales. (D) Correlation of SIV-specific Ab titer (by ELISA) and SIV plasma viral load around the time of seroconversion for macaques in the control group (days 16–42 after infection) or CS blockade–treatment group (days 50–98 after infection). Ab titers are plotted as natural log transforms of the Ab titers in B.
Figure 6
Figure 6
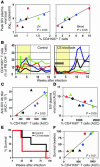
In vivo CD4+ T cell proliferative responses predict the peak level and subsequent control of SIV viremia, titers of SIV-specific Ab’s, and survival of infected macaques. (A) Correlation between the level of CD4+Ki67+ T cells (day 10 after infection) in lymph node or peripheral blood and peak SIV plasma viremia. (B) Levels of CD4+Ki67+ T cells in peripheral blood of macaques in the control group and treatment group (CS blockade). The yellow shading indicates times at which significant differences were determined between groups (P = 0.05, repeated measures analysis of means). The gray bar denotes the treatment period. (C and D) Correlation between the level of CD4+Ki67+ T cells in peripheral blood (AUC: baseline to 16 weeks after infection) and level of anti-SIV Ab’s (AUC: day 6–18 weeks after infection) (C) or the level of SIV plasma viremia (AUC: day 3–16 weeks after infection) (D). (E) Survival of macaques in the control (black) or CS blockade treatment group (red). (F) Correlation between CD4+Ki67+ T cells (AUC: baseline to 16 weeks after infection) and period of survival. (A, C, D, and F) Treated macaques, triangles; control macaques, circles. P values were determined by the Spearman rank correlation test. The solid lines represent regression lines. (A, B, C, D, and F) Control macaques: ROz5 (black), RBm6 (blue), RVy5 (red), RYt5 (green); CS blockade macaques: REp6 (black), REo6 (blue), RIc6 (red), RCr5 (green). PB, peripheral blood.

Comment in

References

    1. Koup RA, et al. Temporal association of cellular immune responses with the initial control of viremia in primary human immunodeficiency virus type 1 syndrome. J. Virol. 1994;68:4650–4655. - PMC - PubMed
    1. Borrow P, Lewicki H, Hahn BH, Shaw GM, Oldstone MB. Virus-specific CD8+ cytotoxic T-lymphocyte activity associated with control of viremia in primary human immunodeficiency virus type 1 infection. J. Virol. 1994;68:6103–6110. - PMC - PubMed
    1. Reimann KA, et al. Immunopathogenic events in acute infection of rhesus monkeys with simian immunodeficiency virus of macaques. J. Virol. 1994;68:2362–2370. - PMC - PubMed
    1. Kuroda MJ, et al. Emergence of CTL coincides with clearance of virus during primary simian immunodeficiency virus infection in rhesus monkeys. J. Immunol. 1999;162:5127–5133. - PubMed
    1. Mellors JW, et al. Prognosis in HIV-1 infection predicted by the quantity of virus in plasma. Science. 1996;272:1167–1170. - PubMed

Publication types

MeSH terms

Substances