. 2004 Mar;113(6):846-55.
doi: 10.1172/JCI19900.

PPARgamma insufficiency enhances osteogenesis through osteoblast formation from bone marrow progenitors

Affiliations

PPARgamma insufficiency enhances osteogenesis through osteoblast formation from bone marrow progenitors

Toru Akune et al. J Clin Invest. 2004 Mar.

Abstract

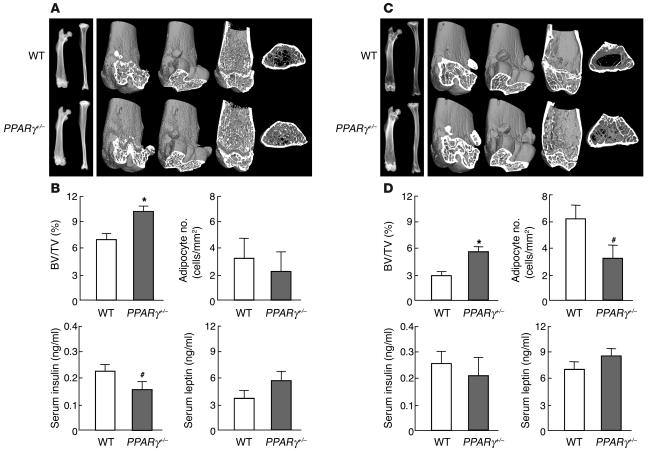
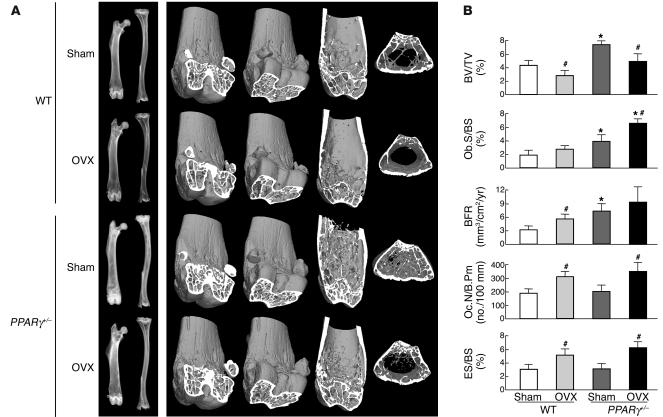
Based on the fact that aging is associated with a reciprocal decrease of osteogenesis and an increase of adipogenesis in bone marrow and that osteoblasts and adipocytes share a common progenitor, this study investigated the role of PPARgamma, a key regulator of adipocyte differentiation, in bone metabolism. Homozygous PPARgamma-deficient ES cells failed to differentiate into adipocytes, but spontaneously differentiated into osteoblasts, and these were restored by reintroduction of the PPARgamma gene. Heterozygous PPARgamma-deficient mice exhibited high bone mass with increased osteoblastogenesis, but normal osteoblast and osteoclast functions, and this effect was not mediated by insulin or leptin. The osteogenic effect of PPARgamma haploinsufficiency became prominent with aging but was not changed upon ovariectomy. The PPARgamma haploinsufficiency was confirmed to enhance osteoblastogenesis in the bone marrow cell culture but did not affect the cultures of differentiated osteoblasts or osteoclast-lineage cells. This study demonstrates a PPARgamma-dependent regulation of bone metabolism in vivo, in that PPARgamma insufficiency increases bone mass by stimulating osteoblastogenesis from bone marrow progenitors.


Figures

Figure 1
Figure 1
Adipogenesis and osteogenesis in the mouse ES cell cultures of homozygous PPARγ-deficient (PPARγ–/–) and WT genotypes. As a rescue experiment, PPARγ was reintroduced into PPARγ–/– ES cells using a retrovirus vector carrying the PPARγ gene (Rx-PPARγ) or the same retrovirus vector without the PPARγ gene (Rx-vector) as a control. (A) The upper row shows the adipogenesis determined by the oil red O staining of the ES cell culture in DMEM/10% FBS with troglitazone. The number of oil red O–positive cells stained in red was counted and shown in the left graph as the cells per square centimeter. The images in the lower row indicate the osteogenesis determined by the von Kossa staining of the ES cell culture in DMEM/10% FBS without any osteogenic supplements. The number of von Kossa–positive calcified nodules stained in black was counted and shown in the right graph as the number per square centimeter. Scale bar: 20 μm. (B) Relative mRNA levels of the marker genes for osteoblasts — COL1A1, osteocalcin and Runx2 — determined by real-time quantitative RT-PCR 10 days after the embryoid bodies were transferred to a gelatinized six-multiwell plate in DMEM/10% FBS without any osteogenic supplements. The ordinate axis indicates the relative amount of mRNA as compared with that of WT. Data are expressed as means (bars) ± SEMs (error bars) for eight wells per group. *Significant difference from the WT culture, P < 0.01. #Significant restoration by Rx-PPARγ as compared with the control PPARγ–/– and PPARγ–/– plus Rx-vector cultures; P < 0.01. Cont, control.
Figure 2
Figure 2
Radiological analysis and blood chemistry of heterozygous PPARγ-deficient (PPARγ+/–) and WT littermates at 8 weeks (A and B) and 52 weeks (C and D) of age. (A and C) Plain x-ray images of femora and tibiae (left) and three-dimensional CT images of distal femora (right) of representative PPARγ+/– and WT littermates. (B and D) Trabecular BV expressed as percentage of total tissue volume (BV/TV [%]) at the distal femora was measured on the CT image. The number of adipocytes in the bone marrow, measured histologically, is shown here for collation with the BV/TV data. Insulin and leptin levels in serum taken just before the sacrifice were quantified using immunoassay kits. Data are expressed as means (bars) ± SEMs (error bars) for eight mice per group for PPARγ+/– and WT mice. Significant difference from WT: *P < 0.01, #P < 0.05.
Figure 3
Figure 3
Histological analysis of the proximal tibiae of PPARγ+/– and WT littermates. (A) Histological features at proximal tibiae of PPARγ+/– and WT littermates. Villanueva-Goldner staining, calcein double labeling, and TRAP staining were done at 8 weeks; toluidine blue staining was done at 52 weeks of age. In Villanueva-Goldner staining, mineralized bone is stained green and unmineralized bone osteoid red; scale bar: 100 μm. In calcein double labeling, the mineralization front is stained as a green line; scale bar: 10 μm. In TRAP staining, TRAP-positive osteoclasts are stained red; scale bar: 100 μm. In toluidine blue staining, adipocytes are observed as oval vacuoles; scale bar: 50 μm. (B) Histomorphometric parameters at 8 weeks of age. Ob.S/BS, percentage of bone surface covered by cuboidal osteoblasts; OS/BS, percentage of bone surface covered by osteoid; MAR, mineral apposition rate; BFR, bone formation rate expressed by MAR times percentage of bone surface exhibiting double labels plus one-half single labels; Oc.N/B.Pm, number of mature osteoclasts in 100 mm of bone perimeter; ES/BS, percentage of eroded surface. Data are expressed as means (bars) ± SEMs (error bars) for eight mice per group for PPARγ+/– and WT mice. *Significant difference from WT, P < 0.01.
Figure 4
Figure 4
Radiological and histomorphometric analyses of OVX and sham-operated (Sham) female littermates of PPARγ+/– and WT genotypes. Female mice underwent surgical operation at 26 weeks and were analyzed at 30 weeks of age. (A) Plain x-ray images of femora and tibiae (left) and three-dimensional CT images of distal femora (right) of representative mice. (B) Histomorphometric parameters. Data are expressed as means (bars) ± SEMs (error bars) for eight mice per group for PPARγ+/– and WT mice. *Significant difference from WT, P < 0.01. #Significant difference from sham, P < 0.05.
Figure 5
Figure 5
Adipogenesis and osteogenesis in the cultures of bone marrow cells from PPARγ+/– and WT littermates. (A) Growth curves of bone marrow cells isolated from PPARγ+/– and WT mice. The adherent bone marrow cells were inoculated at a density of 3 × 10⁵ cells/dish in 10-cm culture dishes. The cells per dish were counted at 1, 2, 3, and 4 days of culture. Data are expressed as means (symbols) ± SEMs (error bars) for eight dishes per group. (B) Adipogenesis determined by oil red O staining in the culture of bone marrow cells in α-MEM/10% FBS with troglitazone. The graph indicates the number of positive cells per square centimeter. (C) Osteogenesis determined by ALP (upper row), Alizarin red (middle row), and von Kossa (lower row) stainings in the culture of bone marrow cells in α-MEM/10% FBS with ascorbic acid and β-glycerophosphate. The graphs below indicate the number of ALP-positive (upper) and Alizarin red–positive (lower) colonies per well. Data are expressed as means (bars) ± SEMs (error bars) for eight wells per group (B and C). *Significant difference from the WT culture, P < 0.01. (D) Expression of key molecules for adipogenesis (PPARγ, C/EBP-β, C/EBP-δ, and C/EBP-α) and osteogenesis (Runx2, osterix, and LRP5), and marker proteins for osteogenesis (COL1A1, ALP, osteocalcin, and osteopontin) determined by quantitative RT-PCR in the bone marrow cells at 14 days of culture under the conditions above. The ordinate axis indicates the relative amount of mRNA as compared with that of WT.

Comment in

  • Fat's loss is bone's gain.
    Pei L, Tontonoz P. Pei L, et al. J Clin Invest. 2004 Mar;113(6):805-6. doi: 10.1172/JCI21311. J Clin Invest. 2004. PMID: 15067310 Free PMC article.

References

    1. Beresford JN. Osteogenic stem cells and the stromal system of bone and marrow. Clin. Orthop. 1989;240:270–280. - PubMed
    1. Pittenger MF, et al. Multilineage potential of adult human mesenchymal stem cells. Science. 1999;284:143–147. - PubMed
    1. Bennett JH, Joyner CJ, Triffitt JT, Owen ME. Adipocytic cells cultured from marrow have osteogenic potential. J. Cell Sci. 1991;99:131–139. - PubMed
    1. Nuttall ME, Patton AJ, Olivera DL, Nadeau DP, Gowen M. Human trabecular bone cells are able to express both osteoblastic and adipocytic phenotype: implications for osteopenic disorders. J. Bone Miner. Res. 1998;13:371–382. - PubMed
    1. Park SR, Oreffo RO, Triffitt JT. Interconversion potential of cloned human marrow adipocytes in vitro. Bone. 1999;24:549–554. - PubMed

Publication types

MeSH terms

Substances