Response of complex networks to stimuli
- PMID: 15070719
- PMCID: PMC384748
- DOI: 10.1073/pnas.0400673101
Response of complex networks to stimuli
Abstract
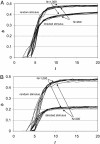
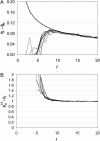
We consider the response of complex systems to stimuli and argue for the importance of both sensitivity, the possibility of large response to small stimuli, and robustness, the possibility of small response to large stimuli. Using a dynamic attractor network model for switching of patterns of behavior, we show that the scale-free topologies often found in nature enable more sensitive response to specific changes than do random networks. This property may be essential in networks where appropriate response to environmental change is critical and may, in such systems, be more important than features, such as connectivity, often used to characterize network topologies. Phenomenologically observed exponents for functional scale-free networks fall in a range corresponding to the onset of particularly high sensitivities, while still retaining robustness.
Figures


References
-
- Watts, D. J. & Strogatz, S. H. (1998) Nature 393, 440–442. - PubMed
-
- Strogatz, S. H. (2001) Nature 410, 268–276. - PubMed
-
- Barabási, A.-L. & Albert, R. (1999) Science 286, 509–512. - PubMed
-
- Albert, R. Jeong, H. & Barabási, A.-L. (1999) Nature 401, 130–131.
-
- Shargel, B., Sayama, H., Epstein I. R. & Bar-Yam, Y. (2003) Phys. Rev. Lett. 90, 068701-1-4. - PubMed
Publication types
MeSH terms
LinkOut - more resources
Full Text Sources
Other Literature Sources

