. 2004 Mar 30;101(13):4447-52.
doi: 10.1073/pnas.0307156101. Epub 2004 Mar 18.

Percolation and criticality in a mitochondrial network

Affiliations

Percolation and criticality in a mitochondrial network

Miguel A Aon et al. Proc Natl Acad Sci U S A. .

Abstract

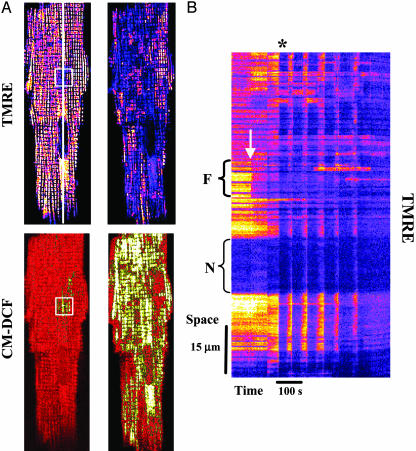
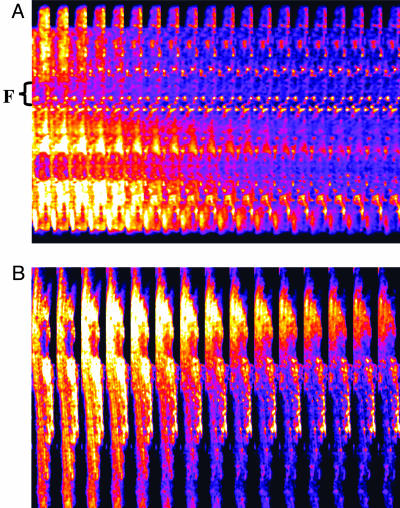
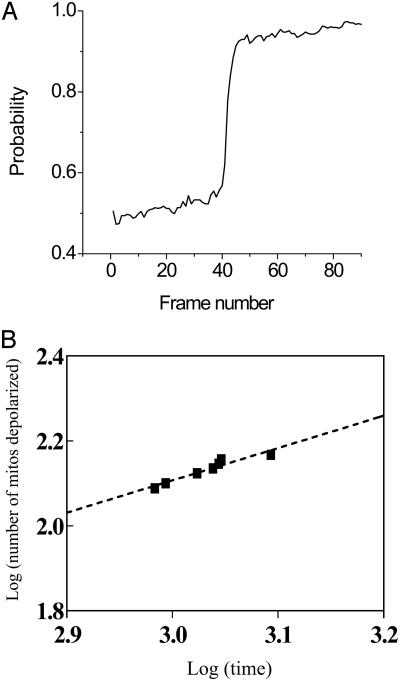
Synchronization of mitochondrial function is an important determinant of cell physiology and survival, yet little is known about the mechanism of interorganellar communication. We have recently observed that coordinated cell-wide oscillations in the mitochondrial energy state of heart cells can be induced by a highly localized perturbation of a few elements of the mitochondrial network, indicating that mitochondria represent a complex, self-organized system. Here, we apply percolation theory to explain the mechanism of intermitochondrial signal propagation in response to oxidative stress. A global phase transition (mitochondrial depolarization) is shown to occur when a critical density of mitochondria accumulate reactive oxygen species above a threshold to form an extended spanning cluster. The scaling and fractal properties of the mitochondrial network at the edge of instability agree remarkably well with the idea that mitochondria are organized as a percolation matrix, with reactive oxygen species as a key messenger.


Figures

Fig. 1.
Fig. 1.
Cell-wide synchronized mitochondrial oscillations after local generation of ROS. (A) Cardiomyocyte loaded at 37°C with TMRE (ΔΨm indicator, upper images) and 5-(–6)-chloromethyl-2′,7′-dichlorohydrofluorescein diacetate (ROS-sensitive, lower images). By using two-photon laser excitation, and after 10–20 control images were collected, a small region of a cardiac myocyte (20 × 20 pixels, 8.7 × 8.7 μm square, ≈81 μm3 volume, and <1 μm focal depth) was excited in a single flash resulting in rapid loss of ΔΨm (A, white square in upper left) and local generation of ROS (A, white square in lower left). Thereafter, ΔΨm remained depolarized in the flashed area throughout the experiment (see B). The right images in A show the first whole-cell ΔΨm depolarization (B, asterisk) after a delay time (see text for further explanation). (B) Time-line image of TMRE created by analyzing a line drawn along the longitudinal axis of the cell (shown in A, upper left; see Methods). The arrow points out the timing of the flash and the brackets point out the flash region (Upper) and the nucleus (Lower). The synchronous ΔΨm mitochondrial oscillations are evident as vertical blue bands. The mitochondria that do not belong to the spanning cluster remained visibly polarized.
Fig. 2.
Fig. 2.
Threshold of ROS required for cell-wide mitochondrial oscillations. (A) Time course of average whole-cell fluorescence of TMRE and CM-DCF, the latter normalized to initial intensity (F/F0). Oscillations in ΔΨm were initiated only when the ROS signal increased by >20% (horizontal dashed line) over the duration of the experiment. The relationship between TMRE and CM-DCF signals and the ROS threshold can be clearly appreciated from the vertical and horizontal reference lines drawn, respectively. Arrow indicates the timing of the flash. (B) Grid analysis of TMRE or CM-DCF fluorescence as applied to a cardiomyocyte (see Methods). (C) Development of the mitochondrial spanning cluster from the flash and up to the time of the first whole cell ΔΨm depolarization (see Fig. 1B, asterisk). At pc = 0.56 (last image on right) a mitochondrial cluster with a critical density, comprising ≈60% of the mitochondrial population, spans the cell. At pc the mitochondrial cluster has a Df = 1.82 as calculated by the box counting method (17). (D) Analysis of the fraction of polarized mitochondria from 2D TMRE and CM-DCF images as a percent of the total mitochondrial population was performed as described (ref. ; see also Methods). The relationship between TMRE and CM-DCF signals can be clearly appreciated from the vertical reference line drawn. Arrow indicates the timing of the flash.
Fig. 3.
Fig. 3.
Model of formula image diffusion between neighboring mitochondria in the spanning cluster. The concentration profiles of formula image were calculated from the solution of a diffusion model (31): formula image where c, x, and t are messenger concentration, distance, and time, respectively. When the solution of Eq. 1 is supposed to depend on a spatial parameter, z = xvt, we obtain: formula image whose solution is: formula image The concentration gradients of formula image between mitochondria as a function of its rate of scavenging, v, were calculated according to Eq. 3 and the following boundary conditions: c(0) = Cmax, and c(∞) = 0. The higher the rate of scavenging, the steeper the gradient and the lower the formula image concentration reaching the second mitochondrion. A maximal distance between two neighboring mitochondria of 0.5 μm was determined. The ROS threshold of 20% was obtained experimentally by image analysis (see Fig. 2 A), and the two mitochondria at the critical state are assumed to belong to the spanning cluster, i.e., they possess a level of ROS very close to the threshold. For those conditions in which ROS near Mito 2 exceeds the threshold, ROS-induced ROS release is predicted. Considering the volume of an average mammalian cell of the order of 4 × 10–12 liters (32) and of single mitochondria, 10–15 liters (≈500–1,000 mitochondria in a plane; e.g., see Fig. 2B), we estimate that the levels of formula image released between neighboring mitochondria would have to be at least in the micromolar range for propagation to occur in the presence of superoxide dismutase (kcat ≈ 1 nmol/s).
Fig. 4.
Fig. 4.
Wave propagation during laser flash-induced whole cell mitochondrial ΔΨm oscillations in cardiomyocytes. Cardiomyocytes labeled with TMRE were subjected to a laser flash, and images were collected at a frame rate of 0.512 s. Under these conditions, waves traveling at speeds of 22 μm·s–1 could be detected (A). In the presence of the ROS scavenger N-acetyl-l-cysteine (4 mM), and with slower image acquisition (3.5 s), waves traveling at 3.5 μm·s–1 were observed (B).
Fig. 5.
Fig. 5.
Quantitative analysis of the mitochondrial network. (A) The probability of a mitochondrion belonging to the spanning cluster increases dramatically at percolation threshold, pc (see also Fig. 2D). This was calculated from frequency histograms of “grid objects” (mitochondria) with CM-DCF fluorescence intensity above baseline. The baseline was obtained averaging the maximal fluorescence value from the frequency distribution of the initial 10–20 images before the flash. The probability was calculated as total number of mitochondria with values above baseline over the total number of objects in the grid. (B) The quantitative relationship between the critical exponents at the first global ΔΨm depolarization can be calculated from double-log plots of the number of depolarized mitochondria versus time near pc (within approximately ±3–5% of pc) for the first global depolarization (15). The straight line conforms to a power law and the total number of depolarized mitochondria scales as t(ν – β)/δ, with t being time. Thus, the slope gives ν – β/δ (= 0.760; r2 = 0.920, for the example presented).

References

    1. Aon, M. A. & Cortassa, S. (1997) Dynamic Biological Organization: Fundamentals as Applied to Cellular Systems (Chapman & Hall, London).
    1. Nicolis, G. & Prigogine, I. (1977) Self-Organization in Nonequilibrium Systems: From Dissipative Structures to Order Through Fluctuations (Wiley, New York).
    1. Haken, H. (1991) Synergetics: Can It Help Physiology? (Springer, Berlin).
    1. Kauffman, S. A. (1993) Origins of Order: Self-Organization and Selection in Evolution (Oxford Univ. Press, New York).
    1. Bak, P. (1996) How Nature Works: The Science of Self-Organized Criticality (Copernicus, New York).

LinkOut - more resources