. 2004 Mar 30;101(13):4537-42.
doi: 10.1073/pnas.0400678101. Epub 2004 Mar 19.

Genome-wide identification of DNaseI hypersensitive sites using active chromatin sequence libraries

Affiliations

Genome-wide identification of DNaseI hypersensitive sites using active chromatin sequence libraries

Peter J Sabo et al. Proc Natl Acad Sci U S A. .

Abstract

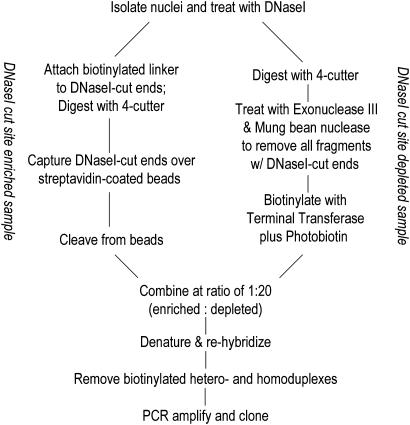
Comprehensive identification of sequences that regulate transcription is one of the major goals of genome biology. Focal alteration in chromatin structure in vivo, detectable through hypersensitivity to DNaseI and other nucleases, is the sine qua non of a diverse cast of transcriptional regulatory elements including enhancers, promoters, insulators, and locus control regions. We developed an approach for genome-scale identification of DNaseI hypersensitive sites (HSs) via isolation and cloning of in vivo DNaseI cleavage sites to create libraries of active chromatin sequences (ACSs). Here, we describe analysis of >61,000 ACSs derived from erythroid cells. We observed peaks in the density of ACSs at the transcriptional start sites of known genes at non-gene-associated CpG islands, and, to a lesser degree, at evolutionarily conserved noncoding sequences. Peaks in ACS density paralleled the distribution of DNaseI HSs. ACSs and DNaseI HSs were distributed between both expressed and nonexpressed genes, suggesting that a large proportion of genes reside within open chromatin domains. The results permit a quantitative approximation of the distribution of HSs and classical cis-regulatory sequences in the human genome.


Figures

Fig. 1.
Fig. 1.
Cloning of active chromatin sequences. We developed a strategy to create genomic DNA libraries containing sequences flanking DNaseI cut sites introduced into nuclear chromatin under limiting (hypersensitive) conditions. After DNA purification, free DNA ends are enzymatically repaired and ligated to a biotinylated linker adaptor. The DNA sample is then fragmented further with a four-cutter enzyme (NlaIII). At this stage, the genome has been partitioned into two predominant fragment populations: NlaIII–NlaIII fragments (derived from the non-DNaseI cut background) and NlaIII-adaptor fragments (carrying for DNaseI cut sites). Adapted DNA is efficiently isolated on paramagnetic streptavidin-coated beads, whereas NlaIII–NlaIII background fragments are cleansed. A second linker adaptor is then appended to the NlaIII end of captured DNA, and the product is released from the beads. This DNaseI cut site-enriched population is enriched and is retained for the subsequent subtraction step. A DNaseI cut site-depleted population is prepared by further fragmenting DNaseI-treated genomic DNA with a four-cutter that leaves a 3′ overhang (e.g., NlaIII). Further digestion of this sample with Exonuclease III followed by mung bean nuclease will preserve the NlaIII–NlaIII fragments (which are resistant to processive degradation), whereas fragments with DNaseI cut ends will be efficiently eliminated. The residual remaining population of DNaseI cut site-depleted DNA is then heavily biotinylated. An excess of this population is mixed with the DNaseI cut site-enriched population, and the sample is denatured and is slowly reannealed. Nonbiotinylated fragments generated by repeated DNaseI cleavage events at or around the same genomic coordinate (i.e., a hypersensitive site) will be more likely to self-anneal than find a partner in the DNaseI cut site-depleted population. Sites that have only been cut once (i.e., due to non-HS-specific cutting or to genomic shear) will form heteroduplexes. Extraction of the mixture with paramagnetic beads isolates the nonbiotinylated homoduplexes that are now further enriched in DNaseI hypersensitive sites. This population is PCR-amplified and cloned to make the genomic ACS libraries.
Fig. 2.
Fig. 2.
Genomic distribution of ACSs parallels genes. Distribution of ACSs (small vertical bars, top) and genes (ensembl) are shown along 33.1 Mb of human chromosome 21. Vertical stacking of ACSs and genes is due to compactness of the horizontal axis.
Fig. 3.
Fig. 3.
Density of ACS peaks at TSSs and CpG islands. y axes show the average number of ACSs per 100 bp bin; x axes show normalized distance (kb) relative to TSSs (a) and 3′ transcription termini of 16,169 RefSeq genes (b), and to promoter-associated (c) and non-promoter-associated (d) CpG islands. Peaks in ACS density at TSSs and at CpG islands are evident whereas no peak is found at 3′ transcript termini. ACS density peaks at CpG islands are evident even when non-promoter-associated CpGs are considered (d). Centered distances of the ACSs from each genomic feature set were computed by using a fractional counting technique to avoid the problem of multiply assigned ACSs. The number of times an ACS was assigned to a genomic feature was recorded, and a histogram corresponding with equal subdivisions was constructed wherein the number of ACSs assigned to each class was scaled by the fractional multiple assignment count. Thus, if an ACS was assigned to two distinct TSSs, a value of 1/2 was assigned to each histogram class. Finally, normalizing the classes by the total number of assigned tags gives the average tag density in the class as depicted.
Fig. 4.
Fig. 4.
Distribution of ACSs as a function of gene expression (a and b) and distribution of ACS clusters relative to TSSs and CNGs (c and d). For explanation of the y axes, see Fig. 3. The x axes show normalized distance (kb) relative to TSS (ac) and to CNGs (d). (a and b) Distribution of ACSs vs. expressed (a) and nonexpressed (b) genes. Genes (RefSeq) were categorized according to whether or not they were expressed in K562 cells. The average density of ACSs within 25-kb windows around TSSs of expressed and nonexpressed genes was computed. ACSs show a clear preference for expressed genes. However, a prominent peak in ACS density is still evident at nonexpressed genes, suggesting that many of these lie within open chromatin domains. (c and d) ACS clusters provide more powerful discrimination. We identified 3,293 ACS clusters comprising 2–8 ACSs distributed within a 1-kb window. ACS clusters (green) are better predictors of DNaseI hypersensitivity than ACSs (orange) (see text) and show more prominent aggregation around known or suspected functional genomic landmarks including TSSs (c), CpG islands (not shown), and evolutionarily conserved nongenic sequences (d). Note the difference in y axis scale vs. Fig. 3 and a and b. Relative densities were calculated as described in Fig. 3.

References

    1. Felsenfeld, G. (1996) Cell 86, 13–19. - PubMed
    1. Felsenfeld, G. & Groudine, M. (2003) Nature 421, 448–453. - PubMed
    1. Gross, D. S. & Garrard, W. T. (1988) Annu. Rev. Biochem. 57, 159–197. - PubMed
    1. Elgin, S. C. (1984) Nature 309, 213–214. - PubMed
    1. Wu, C. (1980) Nature 286, 854–860. - PubMed

LinkOut - more resources