. 2004 Mar 30;101(13):4566-71.
doi: 10.1073/pnas.0400885101. Epub 2004 Mar 16.

Differential dependence of CD4+CD25+ regulatory and natural killer-like T cells on signals leading to NF-kappaB activation

Affiliations

Differential dependence of CD4+CD25+ regulatory and natural killer-like T cells on signals leading to NF-kappaB activation

Marc Schmidt-Supprian et al. Proc Natl Acad Sci U S A. .

Abstract

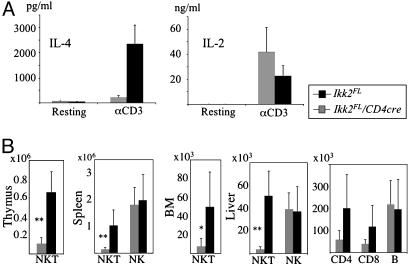
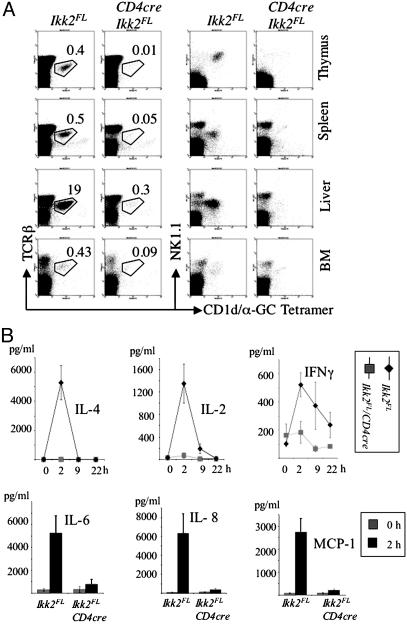
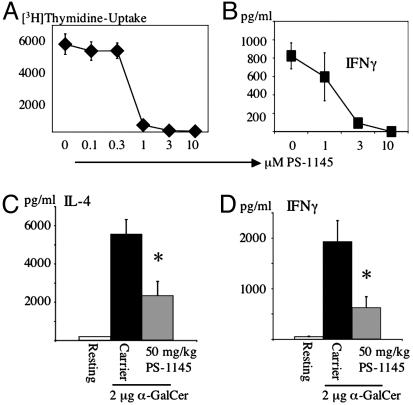
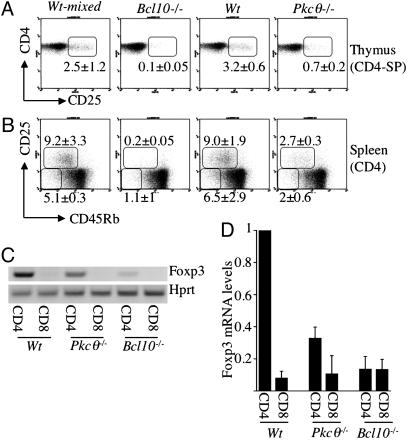
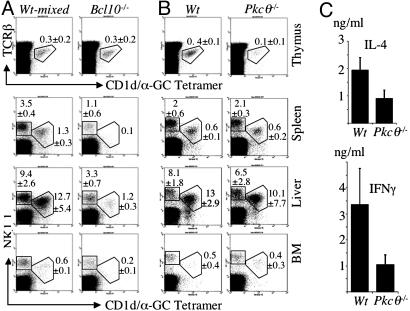
Natural killer-like (NK) T, regulatory T (TR), and memory type T cells display surface phenotypes reminiscent of activated T cells. Previously, we reported that the generation of TR cells and, to a lesser extent, of memory type T cells, depends on IkappaB kinase 2. Here, we show that T cell-specific ablation of IkappaB kinase 2, in addition, completely precludes NKT cell development. T cell antigen receptor (TCR)-induced signals to activate NF-kappaB are essential for mature T cell activation, leading us to hypothesize that this pathway could play an important role in the generation of the antigen-driven T cell subsets comprising TR, memory type T, and NKT cells. TCR-mediated NF-kappaB activation critically depends on Bcl10 and PKCtheta. By using mice deficient for these proteins, we demonstrate that the generation of TR and, to a lesser extent, of memory type T cells, depends on Bcl10 and PKCtheta, and therefore, most likely on NF-kappaB activation initiated by TCR engagement. NKT cells, on the other hand, require PKCtheta for thymic development, whereas absence of Bcl10 leads primarily to the reduction of peripheral NKT cell numbers.


Figures

Fig. 1.
Fig. 1.
Reduction of NKT cells in CD4-Cre/Ikk2FL mice. (A) Histograms showing serum levels of IL-4 and IL-2 2 h after i.p. injection of αCD3 Abs in CD4-Cre/Ikk2FL (gray bars, n = 5) and Ikk2FL control mice (black bars, n = 5). Error bars indicate SEM. P ≤ 0.001; Student's t test. (B) Bar charts of absolute TCRβ+NK1.1+ cell numbers in thymus, spleen, BM, and liver of CD4-Cre/Ikk2FL and control mice. Absolute NK cell numbers are shown for spleen and liver, and CD4 T, CD8 T, and B cell numbers are shown for the liver. Gray bars represent CD4-Cre/Ikk2FL mice (n ≥ 9), and black bars represent control mice (Ikk2FL; n ≥ 9). Error bars indicate SD. *, P ≤ 0.05; **, P ≤ 0.001; Student's t test.
Fig. 2.
Fig. 2.
Analysis of presence and function of α-GalCer-reactive NKT cells in CD4-Cre/Ikk2FL mice. (A) FACS analysis of NKT cells in thymus, spleen, liver, and BM of CD4-Cre/Ikk2FL and control mice by using CD1d/α-GalCer tetramers. Numbers indicate mean percentages of gated cell population of live lymphocytes calculated from two mice, respectively. (B) Histograms and bar charts of cytokine serum levels after injection of α-GalCer. Cytokine levels were determined in the serum collected at various time points from CD4-Cre/Ikk2FL (n = 4) and control mice (n = 5). Error bars represent SEM.
Fig. 3.
Fig. 3.
Inhibition of NKT cell function by PS-1145. (A and B) Splenocyte cultures were activated for 3 days with α-GalCer (200 ng/ml) in the presence of various amounts of the IKK2-inhibitor PS-1145. After 3 days, proliferation was monitored by [3H]thymidine incorporation (A), and IFN-γ levels were determined by ELISA (B). (C and D) Mice were pretreated with PS-1145 or carrier perorally 1.5 h before injection of 2 μgof α-GalCer. Three hours after injection of α-GalCer, serum was removed to determine IL-4 and IFN-γ levels by ELISA. Each bar represents the mean calculated from five mice, error bars indicate the SEM. *, P ≤ 0.05; Student's t test.
Fig. 4.
Fig. 4.
Regulatory and memory type T cells in Bcl10–/– in Pkcθ–/– mice. (A and B) FACS analysis of CD4+CD25+ TR cells in the thymus (A) and of TR and memory type T cells in the spleen (B) of Bcl10–/–, Pkcθ–/–, and appropriate control mice. Numbers indicate mean and SD of the percentages of CD4+CD25+ T cells of CD4-SP thymocytes (A) and of CD25+CD45Rbint T and CD25CD45Rblow T cells of splenic CD4 T cells (B), determined from five mice, respectively. Pkcθ–/– mice were on a pure C57BL/6 genetic background, whereas the Bcl10–/– mice were on a C57BL/6–129 mixed genetic background; therefore, the data obtained from the respective age- and sex-matched control mice are shown separately. (C) RT-PCR showing levels of Foxp3- and Hprt-specific transcripts amplified from total mRNA purified from CD4 and CD8 T cells from Bcl10–/–, Pkcθ–/–, and control mice. One of at least three independent experiments is shown for each genotype. (D) Quantification of Foxp3 mRNA levels in indicated T cell subsets purified from WT (n = 6), Pkcθ–/– (n = 3), and Bcl10–/– (n = 3) mice by real-time PCR. Foxp3 mRNA expression is normalized to expression of Hprt mRNA: Foxp3Hprt-message. The mean Foxp3Hprt-message in CD4 T cells purified from WT mice was set to 1. Foxp3Hprt-message in WT CD8 T cells and CD4 and CD8 T cells purified from Pkcθ–/– and Bcl10–/– mice was calculated relative to Foxp3Hprt-message (WT CD4 T cells) = 1. Results are shown as the mean, and error bars indicate the SEM.
Fig. 5.
Fig. 5.
Analysis of NK and NKT cells in Bcl10–/– and Pkcθ–/– mice. (A and B) FACS analysis of NKT and NK cells in thymus, spleen, liver, and BM of Bcl10–/– and control mice (A) and Pkcθ–/– and control mice (B) using CD1d/α-GalCer tetramers. Numbers indicate mean percentages and SD (n = 4–5 mice for each genotype) of NK or NKT cells of live cells in the lymphocyte gate. (C) Bar charts of IL-4 and IFN-γ serum levels after injection of α-GalCer. IL-4 and IFN-γ levels were determined in the serum collected 3 h after injection from Pkcθ–/– (n = 5) and control mice (n = 5). Error bars represent the SEM.

References

    1. Von Boehmer, H., Aifantis, I., Gounari, F., Azogui, O., Haughn, L., Apostolou, I., Jaeckel, E., Grassi, F. & Klein, L. (2003) Immunol. Rev. 191, 62–78. - PubMed
    1. Ramsdell, F. (2003) Immunity 19, 165–168. - PubMed
    1. Kronenberg, M. & Gapin, L. (2002) Nat. Rev. Immunol. 2, 557–568. - PubMed
    1. Shevach, E. M. (2002) Nat. Rev. Immunol. 2, 389–400. - PubMed
    1. Jordan, M. S., Boesteanu, A., Reed, A. J., Petrone, A. L., Holenbeck, A. E., Lerman, M. A., Naji, A. & Caton, A. J. (2001) Nat. Immunol. 2, 301–306. - PubMed

Publication types

MeSH terms