

The temporal expression profile of Mycobacterium tuberculosis infection in mice
- PMID: 15070764
- PMCID: PMC384793
- DOI: 10.1073/pnas.0306023101
The temporal expression profile of Mycobacterium tuberculosis infection in mice
Abstract
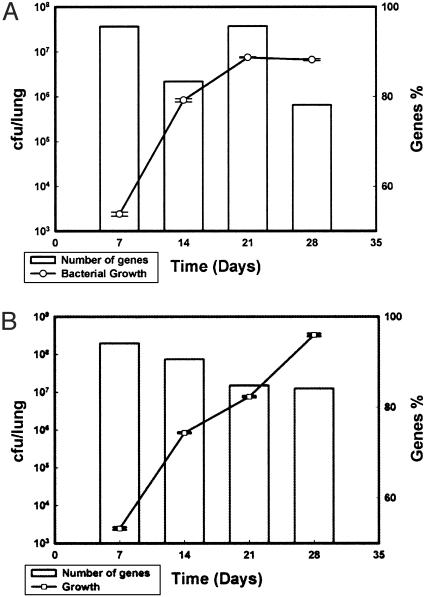
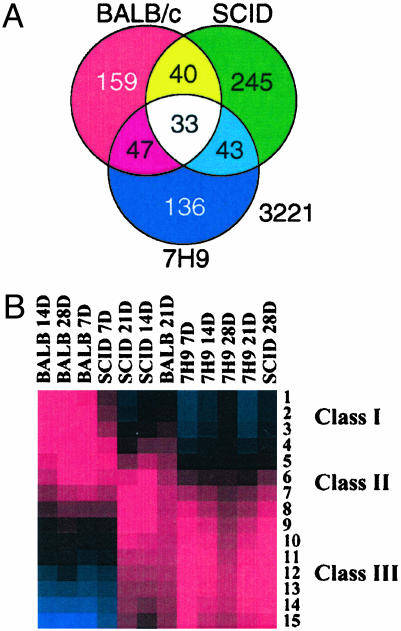
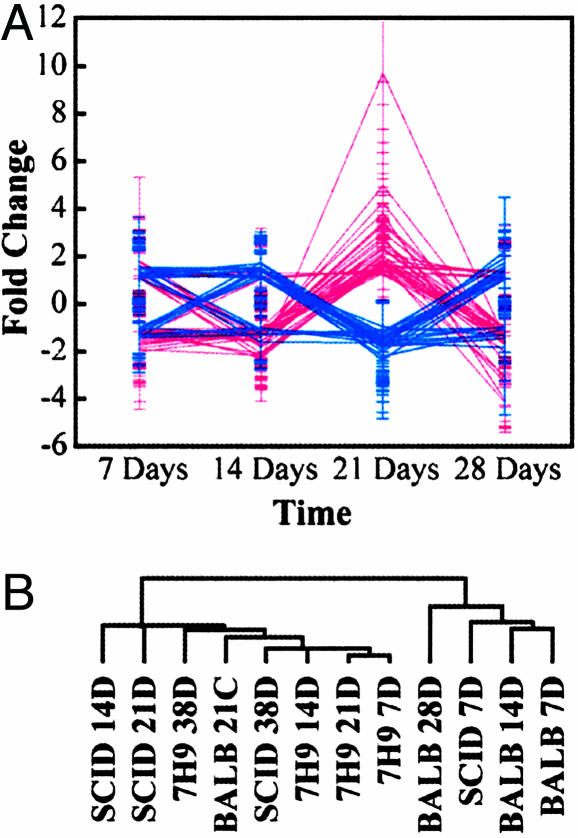
Infection with Mycobacterium tuberculosis causes the illness tuberculosis with an annual mortality of approximately 2 million. Understanding the nature of the host-pathogen interactions at different stages of tuberculosis is central to new strategies for developing chemotherapies and vaccines. Toward this end, we adapted microarray technology to analyze the change in gene expression profiles of M. tuberculosis during infection in mice. This protocol provides the transcription profile of genes expressed during the course of early tuberculosis in immune-competent (BALB/c) and severe combined immune-deficient (SCID) hosts in comparison with growth in medium. The microarray analysis revealed clusters of genes that changed their transcription levels exclusively in the lungs of BALB/c, SCID mice, or medium over time. We identified a set of genes (n = 67) activated only in BALB/c and not in SCID mice at 21 days after infection, a key point in the progression of tuberculosis. A subset of the lung-activated genes was previously identified as induced during mycobacterial survival in a macrophage cell line. Another group of in vivo-expressed genes may also define a previously unreported genomic island. In addition, our analysis suggests the similarity between mycobacterial transcriptional machinery during growth in SCID and in broth, which questions the validity of using the SCID model for assessing mycobacterial virulence. The in vivo expression-profiling technology presented should be applicable to any microbial model of infection.
Figures

References
-
- Krinos, C. M., Coyne, M. J., Weinacht, K. G., Tzianabos, A. O. & Kasper, D. L. (2001) Nature 414, 555-558. - PubMed
-
- Sturgill-Koszycki, S., Schlesinger, P. H., Chakraborty, P., Haddix, P. L., Collins, H. L., Fok, A. K., Allen, R. D., Gluck, S. L., Heuser, J. & Russell, D. G. (1994) Science 263, 678-681. - PubMed
-
- Dye, C., Scheele, S., Dolin, P., Pathania, V. & Raviglione, R. C. (1999) J. Am. Med. Assoc. 282, 677-686. - PubMed
Publication types
MeSH terms
LinkOut - more resources
Full Text Sources
Other Literature Sources
Medical
Molecular Biology Databases
