. 2004 Mar 30;101(13):4695-700.
doi: 10.1073/pnas.0306931101. Epub 2004 Mar 15.

Mice lacking pro-opiomelanocortin are sensitive to high-fat feeding but respond normally to the acute anorectic effects of peptide-YY(3-36)

Affiliations

Mice lacking pro-opiomelanocortin are sensitive to high-fat feeding but respond normally to the acute anorectic effects of peptide-YY(3-36)

B G Challis et al. Proc Natl Acad Sci U S A. .

Abstract

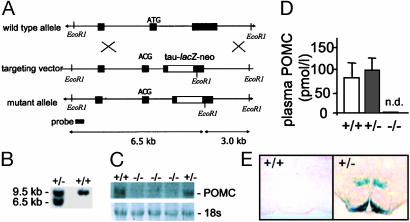
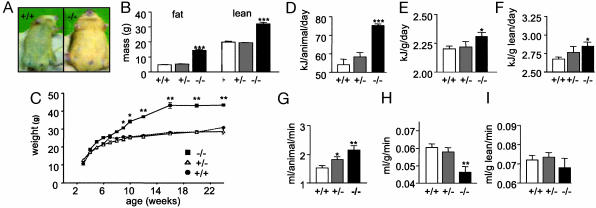
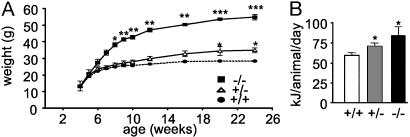
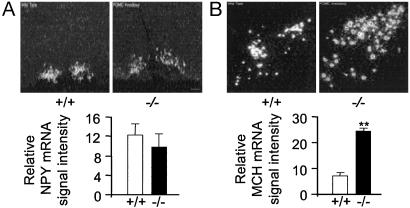
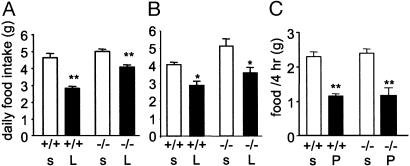
Inactivating mutations of the pro-opiomelanocortin (POMC) gene in both mice and humans leads to hyperphagia and obesity. To further examine the mechanisms whereby POMC-deficiency leads to disordered energy homeostasis, we have generated mice lacking all POMC-derived peptides. Consistent with a previously reported model, Pomc(-/-) mice were obese and hyperphagic. They also showed reduced resting oxygen consumption associated with lowered serum levels of thyroxine. Hypothalami from Pomc(-/-) mice showed markedly increased expression of melanin-concentrating hormone mRNA in the lateral hypothalamus, but expression of neuropeptide Y mRNA in the arcuate nucleus was not altered. Provision of a 45% fat diet increased energy intake and body weight in both Pomc(-/-) and Pomc(+/-) mice. The effects of leptin on food intake and body weight were blunted in obese Pomc(-/-) mice whereas nonobese Pomc(-/-) mice were sensitive to leptin. Surprisingly, we found that Pomc(-/-) mice maintained their acute anorectic response to peptide-YY(3-36) (PYY(3-36)). However, 7 days of PYY(3-36) administration had no effect on cumulative food intake or body weight in wild-type or Pomc(-/-) mice. Thus, POMC peptides seem to be necessary for the normal response of energy balance to high-fat feeding, but not for the acute anorectic effect of PYY(3-36) or full effects of leptin on feeding. The finding that the loss of only one copy of the Pomc gene is sufficient to render mice susceptible to the effects of high fat feeding emphasizes the potential importance of this locus as a site for gene-environment interactions predisposing to obesity.


Figures

Fig. 1.
Fig. 1.
Targeted deletion of the murine Pomc locus. (A) Schematic diagrams and partial restriction maps of the mouse wild-type Pomc locus, Pomc targeting vector, and mutant Pomc allele. The filled boxes represent Pomc coding sequence or 5′ probe. The open boxes represent the tau-lacZ-PGK-neor cassette. The loxP sites (not shown) are in direct orientation such that a Cre-mediated recombination event would cause removal of the PGK promoter and neor coding sequence. (B) Southern blot analysis of tail DNA from wild-type and Pomc+/- mice digested with EcoRI. The 9.5-kb band represents the wild-type allele whereas the lower, 6.5-kb band represents the targeted allele. (C) Northern blot analysis showing an absence of POMC mRNA expression in brains from Pomc-/- mice. (Lower) UVL photograph of 18s RNA as loading control. (D) Two-site immunoassay showing that peripheral POMC peptides are not detectable (n.d.) in plasma from Pomc-/- mice. (E) Histochemical staining for β-galactosidase activity in brains from Pomc+/- mice demonstrated POMC-expressing neurons projecting from the arcuate nucleus to hypothalamic and extra-hypothalamic sites. No staining is observed in brains from wild-type mice.
Fig. 2.
Fig. 2.
Phenotype of Pomc-/- mice. (A) Pomc-/- mice develop obesity and have a lighter coat color compared with a sex- and age-matched 4-month-old wild-type littermate. (B) Fat and lean mass were determined by dual-energy x-ray absorptiometry (DEXA) of group-housed 2- to 3-month-old male mice. The data represent the means ± SEM. n = 5 for each genotype. ***, P < 0.001 compared with wild-type mice. (C) Body weights of group-housed male mice on low-fat diet (wild-type, n = 10; Pomc+/-, n = 10; Pomc-/-, n = 4). Body weight of Pomc-/- mice is statistically different from wild type (*, P < 0.05 at 10 weeks, reaching **, P < 0.01 at 24 weeks). There is no difference between growth curves of wild-type and Pomc+/- mice. (D) Food intake of individually housed 2-month-old male mice maintained on a low-fat diet (n = 8 for each genotype). Data were corrected for total body mass (E) and lean body mass (F). Pomc-/- vs. wild-type mice, *, P < 0.05, ***, P < 0.001. (G) Oxygen consumption in 3-month-old male mice was determined by indirect calorimetry as described (n = 5 for each genotype). Data were corrected for total body mass (H) and lean body mass (I). Pomc-/- vs. wild-type mice, *, P < 0.05, **, P < 0.01.
Fig. 3.
Fig. 3.
Effects of high-fat feeding in Pomc-/-, Pomc+/-, and wild-type mice. (A) On a high-fat diet, Pomc-/- mice are significantly heavier at 8 weeks (*, P < 0.05) and attain a greater adult body weight compared with wild-type mice (wild-type, n = 10, Pomc+/-, n = 10; Pomc-/-, n = 4). ***, P < 0.001. Pomc+/- mice also develop obesity on a high-fat diet compared with wild-type mice by 20 weeks (*, P < 0.05). (B) Food intake of individually housed 2-month-old male mice maintained on a high-fat diet (n = 4 for each group). Pomc-/- and Pomc+/- vs. wild-type mice, *, P < 0.05.
Fig. 4.
Fig. 4.
Hypothalamic NPY and MCH mRNA expression in Pomc-/- and wild-type mice. (A) Pomc-/- mice have normal levels of NPY mRNA in the arcuate nucleus but an absence of NPY in the DMH. Shown are representative darkfield photomicrographs of the arcuate nucleus from male wild-type and Pomc-/- mice. (Scale bar = 150 μm.) Graphed data represent mean of four consecutive brain sections taken from a single brain. Four brains of each genotype were analyzed. (B) MCH mRNA levels are elevated in the lateral hypothalamus of Pomc-/- mice. Shown are representative darkfield photomicrographs of the lateral hypothalamus in a wild-type and Pomc-/-. (Scale bar = 200 μm.) Graphed data represent mean of six consecutive brain sections taken from a single brain. Five brains of each genotype were analyzed. **, P < 0.01.
Fig. 5.
Fig. 5.
Effects of leptin and PYY3-36 on feeding in Pomc-/- and wild-type mice. (A and B) Response of 12- to 15-week-old (A; n = 6 for all groups) and 4-week-old (B; n = 4-7) freely feeding, male wild-type and Pomc-/- mice to peripherally administered leptin. Data represent mean ± SEM daily food intake over 4 days of saline (s) or leptin (L) treatment. Leptin vs. saline, *, P < 0.05, **, P < 0.01. (C) Acute feeding response of 12- to 15-week-old, fasted, male wild-type and Pomc-/- mice to PYY3-36 or saline administered i.p. Data represent mean ± SEM food intake 4 h after saline or PYY3-36 treatment. n = 8 for all groups. PYY3-36 (P) vs. saline (s), **, P < 0.01.

References

    1. Cowley, M. A., Smart, J. L., Rubinstein, M., Cerdan, M. G., Diano, S., Horvath, T. L., Cone, R. D. & Low, M. J. (2001) Nature 411, 480-484. - PubMed
    1. Heisler, L. K., Cowley, M. A., Tecott, L. H., Fan, W., Low, M. J., Smart, J. L., Rubinstein, M., Tatro, J. B., Marcus, J. N., Holstege, H., et al. (2002) Science 297, 609-611. - PubMed
    1. Batterham, R. L., Cowley, M. A., Small, C. J., Herzog, H., Cohen, M. A., Dakin, C. L., Wren, A. M., Brynes, A. E., Low, M. J., Ghatei, M. A., et al. (2002) Nature 418, 650-654. - PubMed
    1. Saper, C. B., Chou, T. C. & Elmquist, J. K. (2002) Neuron 36, 199-211. - PubMed
    1. Schwartz, M. W., Woods, S. C., Porte, D., Jr., Seeley, R. J. & Baskin, D. G. (2000) Nature 404, 661-671. - PubMed

Publication types

MeSH terms