. 2004 Apr 7;24(14):3574-82.
doi: 10.1523/JNEUROSCI.5361-03.2004.

Reduction of single-neuron firing uncertainty by cortical ensembles during motor skill learning

Affiliations

Reduction of single-neuron firing uncertainty by cortical ensembles during motor skill learning

Dana Cohen et al. J Neurosci. .

Abstract

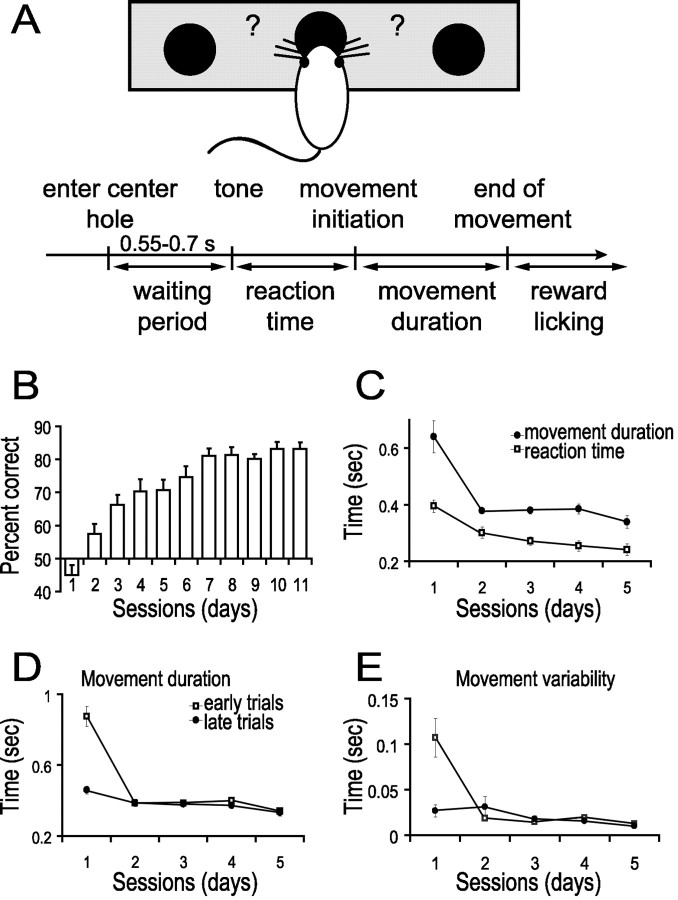
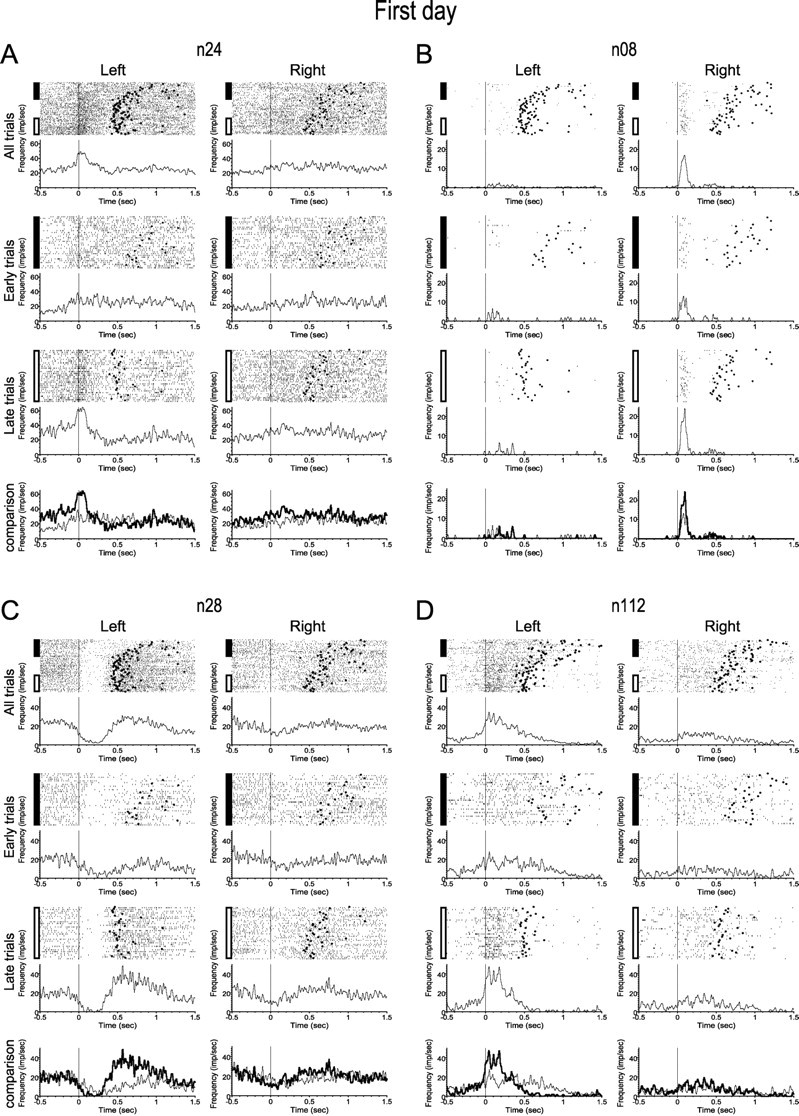
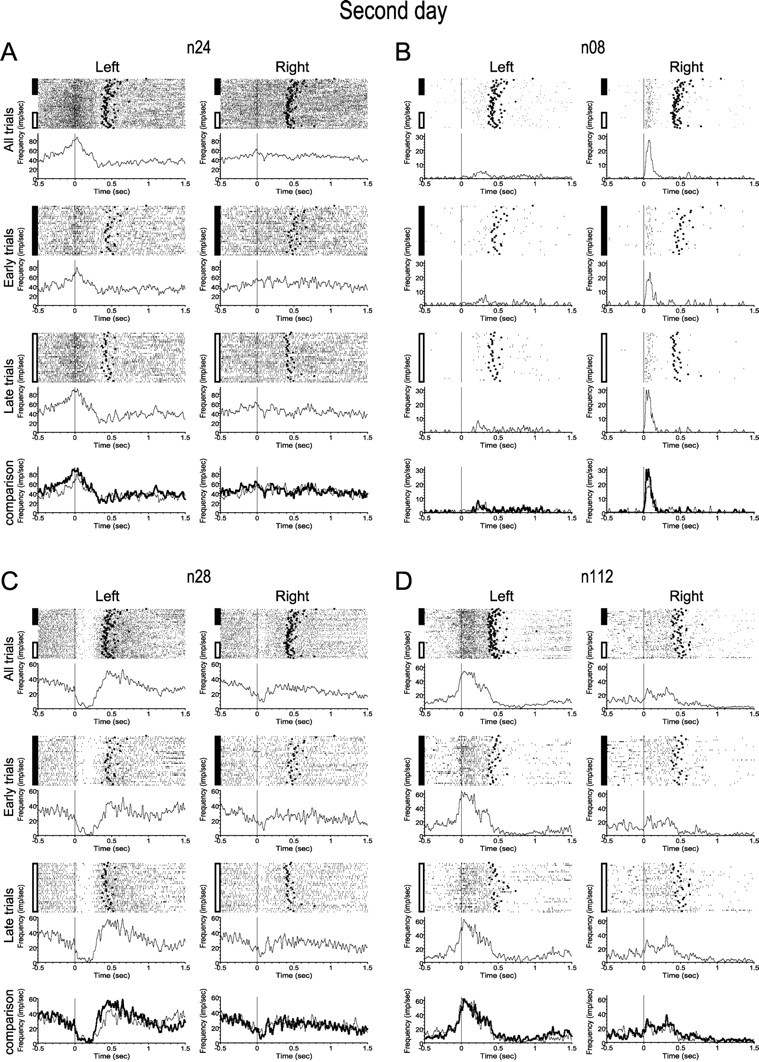
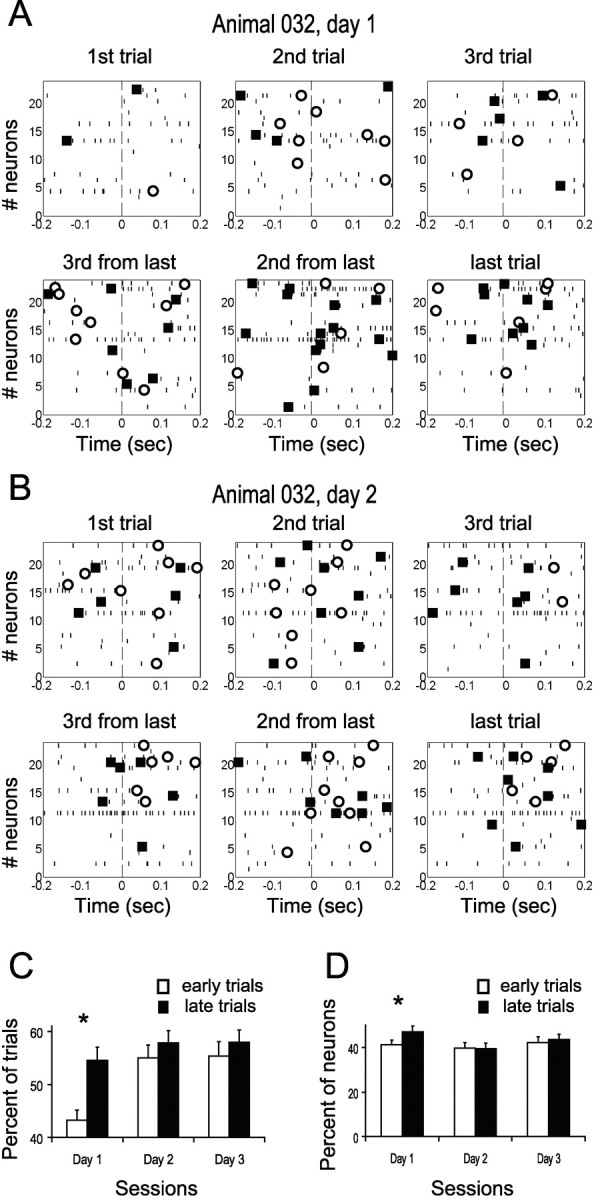
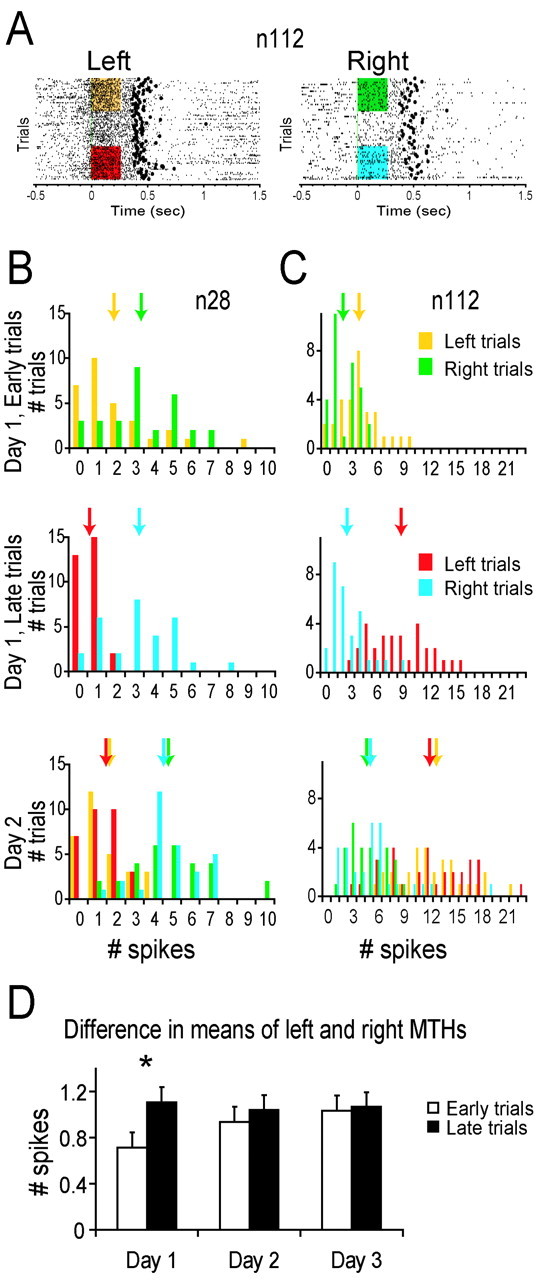
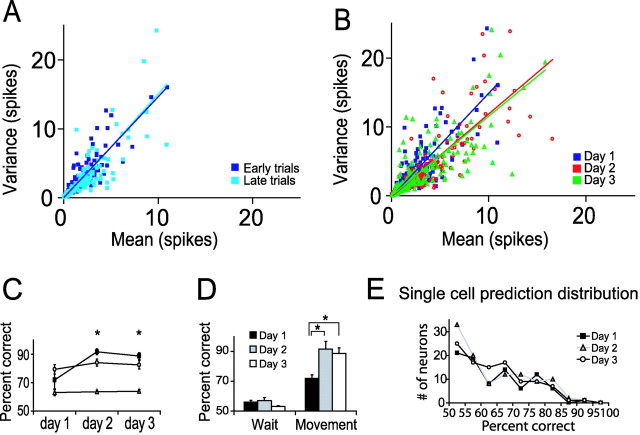
Motor skill learning is usually characterized by shortening of response time and performance of faster, more stereotypical movements. However, little is known about the changes in neural activity that underlie these behavioral changes. Here we used chronically implanted electrode arrays to record neuronal activity in the rat primary motor cortex (MI) as animals learned to execute movements in two directions. Strong modulation of MI single-neuron activity was observed while movement duration of the animal decreased. Despite many learning-induced changes, the precision with which single neurons fire did not improve with learning. Hence, prediction of movement direction from single neurons was bounded. In contrast, prediction of movement direction using neuronal ensembles improved significantly with learning, suggesting that, with practice, neuronal ensembles learn to overcome the uncertainty introduced by single-neuron stochastic activity.


Figures

Figure 1.
Figure 1.
Practice decreased reaction times, movement times, movement variability, and error frequency. A, Schematic of the behavioral paradigm and time course of a trial. Filled circles represent holes that the rat can nose poke. The rat must discriminate a high tone from a low tone played while in the center hole and then move to the side hole specified by that tone to receive reward. B, On average, rats (n = 13) reached a performance level of 80% by the seventh day. C, Movement time (filled circles) and reaction time (open squares) significantly decreased with training (n = 6 in all analysis from here on). D, A significant reduction in movement duration occurred by the late trials (filled circles) of the first day and on the early trials (open squares) of the second day. E, A significant reduction in movement variability occurred from the early trials (open squares) to the late trials (filled circles) of the first day.
Figure 2.
Figure 2.
On day 1, MI neurons exhibited a variety of changes in firing patterns during execution of the task. A–D, Each panel of graphs shows activity from one neuron. Each graph shows raster plots and the corresponding PETHs, aligned at the beginning of each movement (marked by a black line). The end of each movement is marked by a filled circle. In each graph, trials are presented top to bottom as they were presented during training. The left column in each panel shows activity during left movements, and the right column shows the activity during right movements. The top two graphs show the activity of each neuron observed over the course of the day. The second and third rows show the activity during the early and late trials, respectively. The bottom two graphs show the superimposed PETHs during the early (thin line) and late (thick line) trials. A, Firing modulation developed to one or both directions (in this cell, only to the left). B, The firing pattern became more pronounced. C, A decrease in firing developed or strengthened. D, The duration of movement-related activity was reduced.
Figure 3.
Figure 3.
Neural activity was relatively stable over the course of the second and third days. As in Figure 2, each panel shows activity from a single neuron, this time for day 2. Spike sorting indicated that these four cells were probably the same as the examples used in Figure 2, and the firing patterns of these neurons on day 2 are similar to their activity at the end of day 1. All panels are as in Figure 2.
Figure 4.
Figure 4.
Number of neurons that changed their firing rate around movement initiation increased with practice. A, B, The raster plots show activity of all the neurons recorded simultaneously in one animal during the first three trials and the last three trials to the left for the first (A) and second (B) days. A significant increase in firing rate is marked by a filled square, and a significant decrease is marked by an open circle. Trials were aligned to movement initiation (dashed line). On the first day, the number of neurons with modified firing increased from 6 during the initial three trials to 13.7 during the last three trials. On the second day, the number of neurons with modified firing was 9.7 and 9 during the first and last three trials, respectively. C, The bar plot shows the percent of trials during which MI neurons significantly increased their firing rate near movement initiation for the early and late trials of days 1–3. A significant increase occurred during the first day (n = 172, 214, and 202 on days 1–3, respectively; each neuron contributed independently to left and right movements). D, The average of the number of neurons per trial that significantly modified firing near movement initiation is shown for days 1–3. The number of neurons per trial showing activity modulation significantly increased only during the first day (n = 6).
Figure 5.
Figure 5.
Discriminability of left and right movements based on spike count histograms increased with training. A, Raster plots of movements to the left and right for the same neuron. The color boxes provide the color code for the MTHs of the early and late trials used in B and C. B, Spike counts of a single neuron were averaged over an epoch from 0 to 250 msec after movement initiation. Averages (arrows) are marked both for the early and late trials of the first day (top 2 rows) and on the second day (bottom row). C, Same as B for a different neuron. D, Histogram of the difference in the means of the MTHs to the left and right over the whole population shown for the early and late trials of days 1–3. This difference in activity between left and right increased significantly during the first day but not during subsequent days (n = 86, 107, and 101 on days 1–3, respectively).
Figure 6.
Figure 6.
Movement direction was better predicted by the ensemble compared with single neurons. The ratio between the mean firing and the variance in firing of individual MI neurons did not change with learning. A, The variance of the MTHs was plotted against their means for all neurons during movements to the left and right during the early (dark blue) and late (light blue) trials of the first day. The regression line fit to the plot of the early trials was similar to that of the late trials (n = 172; each neuron contributed to movement both directions). B, Variance–mean plots are shown for all days. The slopes of the regression lines were reasonably approximated by a Poisson distributi on in which the variance equals the mean (A, B, black lines; n = 172, 214, and 202 on days 1–3, respectively). C, Different lines show the best predictions of movement direction by single neurons (open circles), the average predictions of single neurons (open triangles), and the predictions of movement direction by the ensemble (filled squares) for 3 d of training. Predictions of movement direction by the ensemble became significantly better than the best prediction of single neurons (n = 6). D, Histograms of the predictions of movement direction by the ensemble during the waiting period and during movement for the 3 d of training. Prediction of the ensemble significantly improved with training (n = 6). E, Distributions of the predictions of a single neuron for days 1–3. These distributions did not change with learning.

Similar articles

Cited by

References

    1. Averbeck BB, Lee D (2003) Neural noise and movement-related codes in the macaque supplementary motor area. J Neurosci 23: 7630–7641. - PMC - PubMed
    1. Bonato C, Zanette G, Fiaschi A, Rossini PM (2002) Activity-dependent modulation of synaptic transmission in the intact human motor cortex revealed with transcranial magnetic stimulation. Cereb Cortex 12: 1057–1062. - PubMed
    1. Dayan P, Abbott L (2001) Theoretical neuroscience: computational and mathematical modeling of neural systems. Cambridge, MA: MIT.
    1. Dosher BA, Lu ZL (1998) Perceptual learning reflects external noise filtering and internal noise reduction through channel reweighting. Proc Natl Acad Sci USA 95: 13988–13993. - PMC - PubMed
    1. Dubnov S, El-Yaniv R, Gdalyahu Y, Schneidman E, Tishby N, Yona G (2002) A new nonparametric clustering algorithm based on iterative estimation of distance profiles. Machine Learn 47: 35–61.

Publication types

LinkOut - more resources