. 2004 Apr 21;23(8):1699-708.
doi: 10.1038/sj.emboj.7600192. Epub 2004 Apr 8.

Proteolytic E-cadherin activation followed by solution NMR and X-ray crystallography

Affiliations

Proteolytic E-cadherin activation followed by solution NMR and X-ray crystallography

Daniel Häussinger et al. EMBO J. .

Abstract

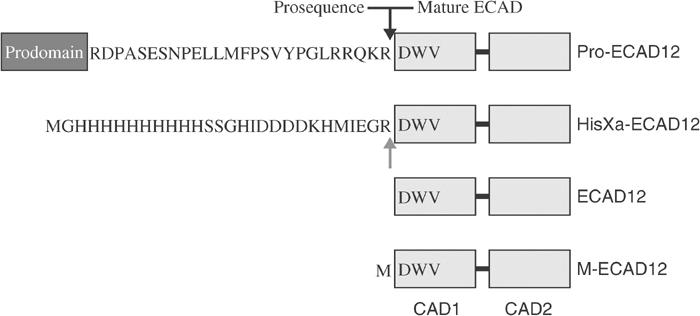
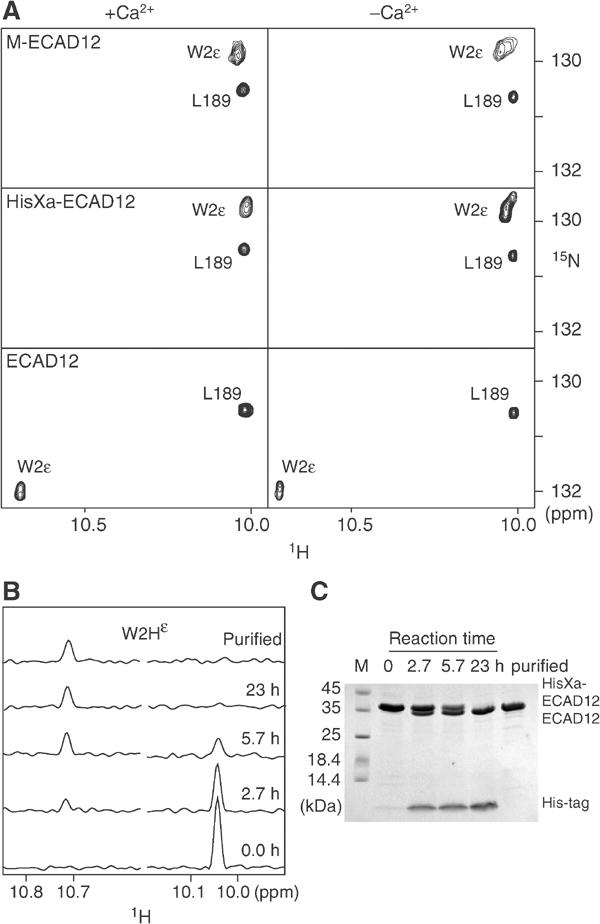
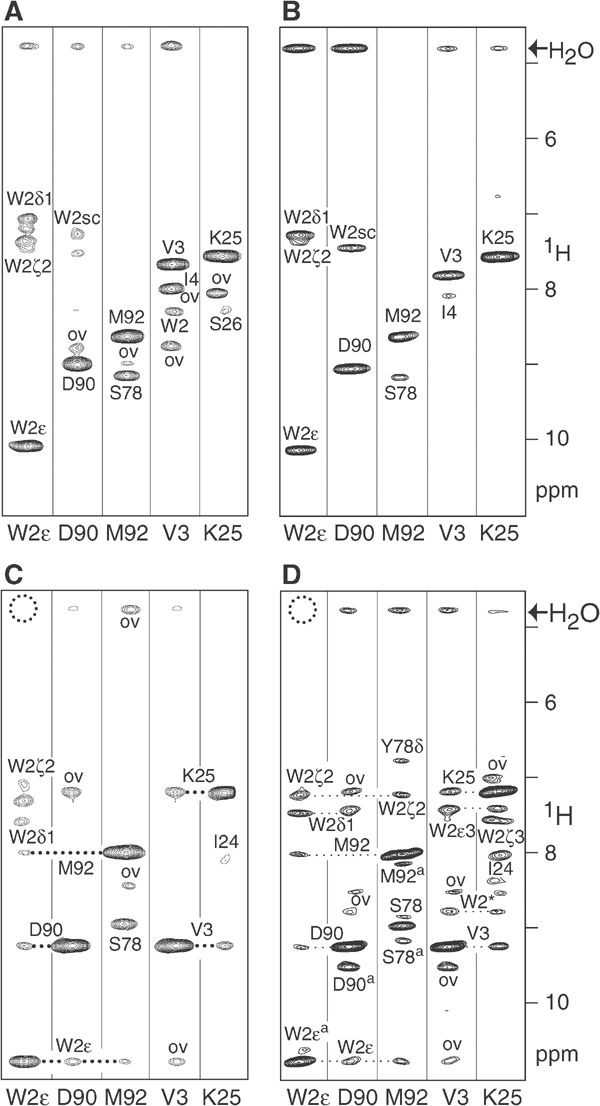
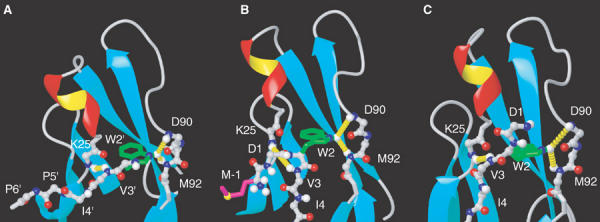
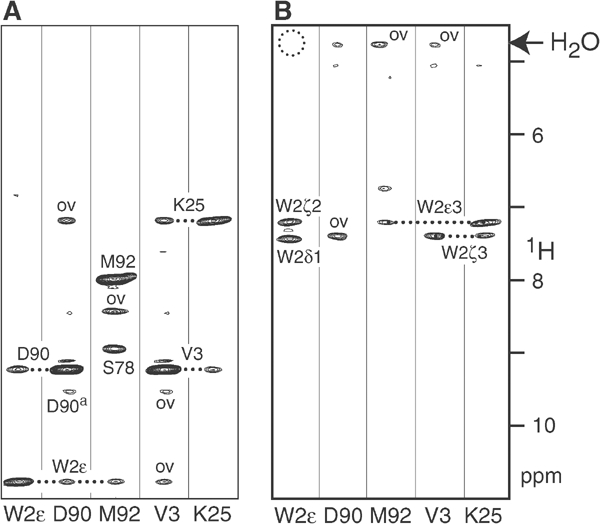
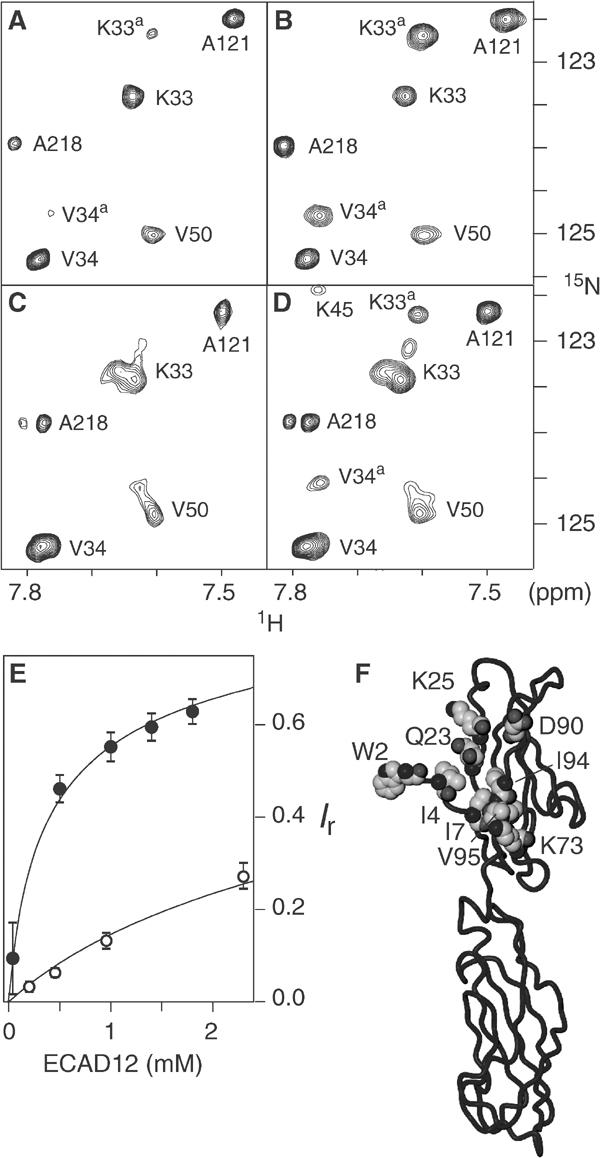
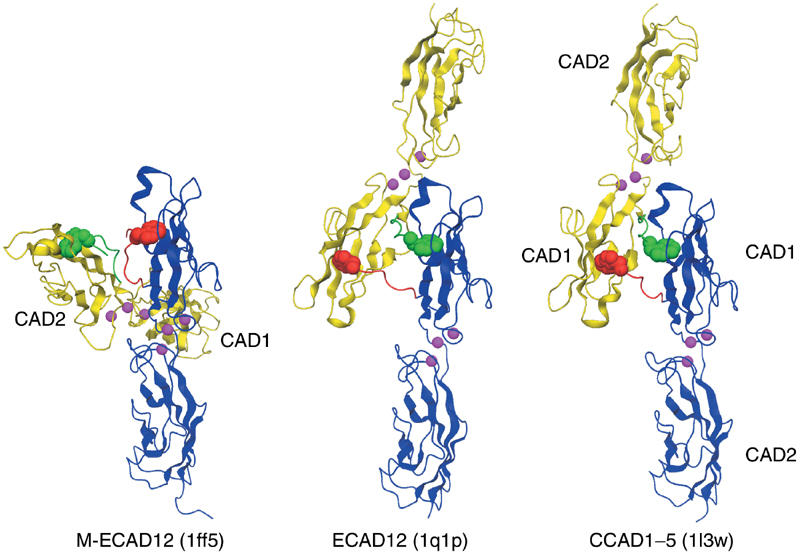
Cellular adhesion by classical cadherins depends critically on the exact proteolytic removal of their N-terminal prosequences. In this combined solution NMR and X-ray crystallographic study, the consequences of propeptide cleavage of an epithelial cadherin construct (domains 1 and 2) were followed at atomic level. At low protein concentration, the N-terminal processing induces docking of the tryptophan-2 side-chain into a binding pocket on the same molecule. At high concentration, cleavage induces dimerization (KD=0.72 mM, k(off)=0.7 s(-1)) and concomitant intermolecular exchange of the betaA-strands and the tryptophan-2 side-chains. Thus, the cleavage represents the switch from a nonadhesive to the functional form of cadherin.


Figures

Figure 1
Figure 1
Schematic representation of prodomain–CAD1 domain boundaries of wild-type murine E-cadherin and E-cadherin constructs used in this study. The cleavage site of the prodomain in the wild-type protein is indicated by a black arrow. In HisXa-ECAD12, this cleavage site is mimicked by the factor Xa cleavage sequence IEGR (gray arrow).
Figure 2
Figure 2
Changes in solution NMR spectra induced by N-terminal processing of ECAD12 in the presence or absence of calcium. (A) Small regions of the 1H-15N TROSY spectra of M-ECAD12 (0.6 mM), HisXa-ECAD12 (1.1 mM), and ECAD12 (0.6 mM) released from HisXa-ECAD12 after protease processing. Spectra are labelled with assignment information. (B) Real-time observation of the effect of HisXa-ECAD12 N-terminal processing on the W2Hɛ resonance. One-dimensional 1H traces were taken from 1H-15N TROSY spectra at the W2Nɛ position of ECAD12 (left) and HisXa-ECAD12 (right) at the indicated times after cleavage start by factor Xa and after the removal of the cleaved-off His-tag. (C) SDS–PAGE observation of HisXa-ECAD12 N-terminal cleavage by factor Xa in the same samples as in (B).
Figure 3
Figure 3
NOE evidence for changes in the conformation of the ECAD12 N-terminus upon N-terminal processing in the presence and absence of calcium. Small regions of the 15N-edited NOESY spectra for several forms of ECAD12 were extracted at the 1H-15N resonance positions of the W2 side-chain and backbone amides of D90, M92, V3, and K25. In all cases, the resonance frequencies of the monomeric species were used. (A) Calcium-free HisXa-ECAD12 (total concentration 1.1 mM). (B) Calcium-free M-ECAD12 (3.5 mM). (C) Calcium-free ECAD12 (1.1 mM). (D) Calcium-bound ECAD12 (1.0 mM). (A–D) Resonances are labelled with assignment information. Peaks resulting from overlap with unrelated resonances are marked by ‘ov'. Owing to incomplete deuteration, several NOEs to W2 side-chain protons are visible. W2sc indicates an unassigned proton resonance of the W2 side-chain. A dotted circle indicates the absence of an exchange peak with water for W2Hɛ. In (D), several peaks show correlations to residues of the associated form due to chemical exchange and are marked by a superscript ‘a'.
Figure 4
Figure 4
Conformation of the N-terminal region of ECAD12 in different crystal forms. (A) Details of the crystal structure of dimeric ECAD12 (1q1p) showing the docking of W2 into the pocket of the partner molecule. Residues that stem from the symmetry equivalent molecule are marked by an apostrophe ('). The same region is shown for the crystal structures of M-ECAD12 (B, 1ff5) (Pertz et al, 1999) and human ECAD1 in complex with internalin (C, 1o6s) (Schubert et al, 2002). Long-range NOEs observed between W2Hɛ↔D90HN/M92HN and V3HN↔K25HN for the monomeric form of ECAD12 (see text and Figure 3C and D) are highlighted by dashed yellow cylinders in all crystal forms (A–C).
Figure 5
Figure 5
15N-selected/15N-edited NOESY experiments to distinguish between intra- and intermolecular interactions. Experiments were carried out on a sample consisting of a 1:1 mixture of uniformly 15N-labelled and natural abundance 14N-ECAD12 (total concentration 1.3 mM, calcium-free conditions) (A) Results of a 15N-selected/15N-edited 3D NOESY experiment. NOE connectivities are only present between protons that are both bonded to 15N nuclei. Associated forms are marked by ‘a'. (B) Results of a (not-15N)-selected/15N-edited NOESY experiment. NOE connectivities are only present between protons that are not bonded to 15N nuclei (vertical axis) and protons bonded to 15N nuclei (horizontal axis).
Figure 6
Figure 6
NMR spectroscopic evidence of ECAD12 homoassociation in the presence and absence of calcium. Small regions of 1H-15N TROSY spectra are shown for total ECAD12 concentrations of 40 μM (A) and 0.5 mM (B) in the presence of calcium, and for 60 μM (C) and 1.1 mM (D) in the absence of calcium. Resonances are labelled with assignment information. The associated species is indicated by a superscript ‘a'. (E) Relative intensity Ir=Ia/(Im+Ia) of the associated species as a function of total ECAD12 concentration. Intensities of the monomeric (Im) and associated (Ia) species were obtained as an average of peak volumes for residues, which showed well-separated resonances. Filled and open circles correspond to calcium-bound and calcium-free conditions, respectively. The solid lines present fits to the data assuming a bimolecular reaction with a KD of 0.72 mM for the calcium-bound and of 10 mM for the calcium-free protein, respectively. (F) Residues that show the strongest observable 1H-15N chemical shift differences between the monomer and associated species in the calcium-bound form are shown in space-fill representation in the crystal structure of ECAD12.
Figure 7
Figure 7
Comparison of the ECAD12, M-ECAD12, and CCAD1–5 crystal structures. The interacting monomers are shown in blue and yellow with their respective N-termini in red and green. The W2 residue is shown as space-fill. For better comparison, the blue CAD12 domains are shown in the same orientation for all three structures. Calcium atoms are indicated in magenta.

References

    1. Alattia JR, Ames JB, Porumb T, Tong KI, Heng YM, Ottensmeyer P, Kay CM, Ikura M (1997) Lateral self-assembly of E-cadherin directed by cooperative calcium binding. FEBS Lett 417: 405–408 - PubMed
    1. Boggon TJ, Murray J, Chappuis-Flament S, Wong E, Gumbiner BM, Shapiro L (2002) C-cadherin ectodomain structure and implications for cell adhesion mechanisms. Science 296: 1308–1313 - PubMed
    1. Brieher WM, Yap AS, Gumbiner BM (1996) Lateral dimerization is required for the homophilic binding activity of C-cadherin. J Cell Biol 135: 487–496 - PMC - PubMed
    1. CCP4 (1994) Collaborative Computing Project No. 4. The CCP4 suite: programs for protein crystallography. Acta Crystallogr D 50: 760–763 - PubMed
    1. Chitaev NA, Troyanovsky SM (1998) Adhesive but not lateral E-cadherin complexes require calcium and catenins for their formation. J Cell Biol 142: 837–846 - PMC - PubMed

Publication types