. 2004 Jun 15;557(Pt 3):909-22.
doi: 10.1113/jphysiol.2004.063529. Epub 2004 Apr 8.

Filtration rate dependence of hyaluronan reflection by joint-to-lymph barrier: evidence for concentration polarisation

Affiliations

Filtration rate dependence of hyaluronan reflection by joint-to-lymph barrier: evidence for concentration polarisation

S Sabaratnam et al. J Physiol. .

Abstract

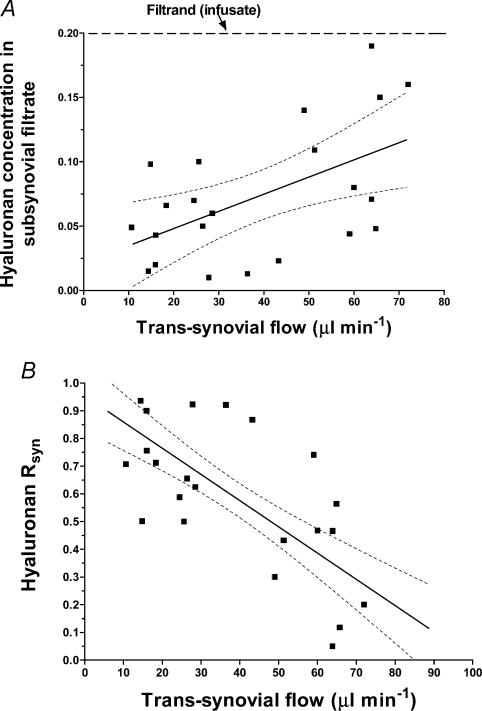
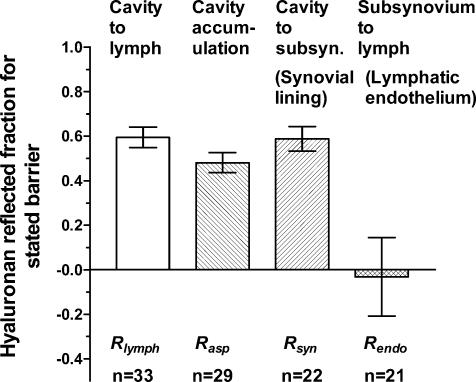
Hyaluronan (HA), a component of synovial fluid, buffers fluid loss from joints. To explain this, a quantitative theory for HA concentration polarisation at a partially sieving synovial lining was developed. The theory predicts a fall in HA reflected fraction R with increased filtration rate. To test this, knees of anaesthetised rabbits were infused with HA and fluorescein-dextran (FD) at constant trans-synovial filtration rates of 6-89 microl min(-1). Samples of femoral lymph, mixed intra-articular fluid and subsynovial fluid after >/= 3 h were analysed by high-performance liquid chromatography. R was calculated as (1 - downstream/upstream concentration), using [FD] to adjust for joint lymph dilution in femoral lymph. Intra-articular HA concentration after >/= 3 h, 0.47 +/- 0.02 mg ml(-1) (mean +/-s.e.m., n= 31), exceeded the infusate concentration, 0.20 mg ml(-1), while subsynovial and lymph [HA] were reduced relative to [FD]. The changes in [HA] demonstrated synovial molecular sieving of HA. R from cavity to lymph (R(lymph)) fell monotonically from 0.93 at 6 microl min(-1) to 0.14 at 89 microl min(-1) (P < 0.0001, regression analysis, n= 33). R values calculated from the intra-articular HA accumulation (R(asp)) or the low subsynovial concentrations (R(syn)) were similar negative functions of filtration rate. R for lymphatic capillary endothelium (R(endo)), calculated from lymph/subsynovial concentration ratios, was effectively zero (-0.03 +/- 0.18, n= 21), confirming that synovium, not initial lymphatic endothelium, is the reflection site. Logarithmic linearisation of the results evaluated the synovial HA reflection coefficient as 0.91. In conclusion, the existence of concentration polarisation during joint fluid drainage was supported by the demonstration of a negative relation between filtration rate and R(lymph), R(asp) and R(syn).


Figures

Figure 1
Figure 1. Theoretical curves for molecular sieving versus filtration rate in the presence (filled symbols) and absence (open symbols) of concentration polarisation
The curves are numerical solutions of eqns (3) and (4) for the solute transmitted fraction (dashed lines) and its complement the reflected fraction (continuous lines). Illustrative parameter values were σ= 0.9 (see later results); D = 4.78 × 10⁻⁸ cm2 s−1 (hyaluronan at 0.2 mg ml−1; Wik & Comper, 1982); polarisation layer thickness δ= 1.54 × 10⁻² cm (filled symbols) (based on δ/D = 3.25 × 10⁵ s cm−1; Coleman et al. 1999) or δ= 0 (open symbols); A = 12.7 cm2 (synovial area at low Pj; Levick 1994); and PA = 3.8 × 10⁻⁶ cm3 min−1 (Coleman et al. 1999).
Figure 2
Figure 2. Effect of the rate of trans-synovial filtration of a hyaluronan–fluorescein–dextran solution on femoral lymph flow (A), femoral lymph hyaluronan concentration (B) and femoral lymph concentration of reference solute fluorescein–dextran (C)
Values are the mean for each study. Solute concentrations are expressed as a fraction of concentration infused into joint cavity. Dashed lines were fitted by linear regression analysis; for regression parameter values, see text.
Figure 3
Figure 3. Effect of the rate of trans-synovial filtration of a 0.2 mg ml−1 hyaluronan solution on the molecular sieving of hyaluronan
A, effect of filtration rate on Rlymph, the reflected fraction for the joint-to-lymph barrier. Regression line through pooled results has a slope of −0.0094 ± 0.0014 min μl−1 (n = 33, r2= 0.59, P < 0.0001; dashed lines, 95% confidence limits). In general only one trans-synovial flow was studied per preparation. In the four cases indicated by long dashes a low filtration rate was followed by a higher filtration rate in the same hind limb. B, effect of filtration rate on Rasp, the reflected fraction calculated from intra-articular aspirates, i.e. from hyaluronan accumulation within the joint cavity. The slope of the regression line is almost identical to that in A; see text.
Figure 4
Figure 4. Effect of filtration rate on the subsynovial hyaluronan concentration (A) and the synovial reflected fraction Rsyn, i.e. hyaluronan reflection between the infusion line and subsynovial space (B)
Since subsynovial hyaluronan concentration increased with filtration rate (A), the reflected fraction decreased with filtration rate (B). Continuous lines fitted by linear regression analysis; dashed lines are 95% confidence limits.
Figure 5
Figure 5. Reflection across the lymphatic capillary endothelium separating the subysnovial space and lymph (Rendo) compared with reflection across the composite synovial cavity-to-lymph barrier (Rlymph) or the synovial cavity-to-subsynovium barrier (Rsyn) or accumulation in joint cavity (Rasp)
Values are the mean ± s.e.m. Rendo is not significantly different from zero (P = 0.85, 1-sample t test); the other values are highly significant (P < 0.0001, 1-sample t test).
Figure 6
Figure 6. Log-linearisation of molecular reflection vs. filtration rate relation in accordance with concentration polarisation theory for high filtration rates (eqn (5))
The data points are the reflected fractions (R) obtained from lymph, subsynovial sample and joint aspirate analyses at filtration rates >20 μl min−1(n = 65). The continuous line is fitted by linear regression analysis and the dashed lines are 95% confidence limits. The y-intercept corresponds to a synovial HA reflection coefficient of 0.91. The slope indicates a polarisation layer thickness of ∼100 μm order of magnitude.
Figure 7
Figure 7. Comparison of observed Rlymph (circles) with predictions of eqn (3) (lines) as filtration rate is raised
A shallow negative slope can arise from progressive shifts across the family of curves, each unique to a specific pressure and filtration rate. Curve A, model prediction for D = 4.78 × 10⁻⁸ cm2 s−1 (Wik & Comper, 1982; at C = 0.2 mg ml−1), A = 11.3 cm2 (Levick, 1994, Table 1, interpolated to lowest Pj studied here), δ= 111 μm (from slope of Fig. 6) and σ= 0.91 (from intercept of Fig. 6). Curve B, effect of increasing the HA diffusivity in the boundary layer due to increased concentration; D = 13.4 × 10⁻⁸ cm2 s−1 at Cm= 2.2 mg ml−1, latter based on σ= 0.91. Other parameters unchanged. The effect of variation in D across the boundary layer, which renders the problem mathematically non-linear, is not treated. Curve C, effect of an increase in A to 20 cm2 due to pressure-induced stretch; the area is 17.4 cm2 at 18 cmH2O (Levick, 1994) and an arbitrary 15% has been added for the unknown, non-linear expansion at higher Pj; other parameters as for curve B. Curve D, effect of reducing boundary layer thickness to 71 μm (lower limit estimated from slope in Fig. 6). Curve E, effect of raising σ to 0.95 (upper confidence interval for intercept, Fig. 6) to illustrate consequences of pore fouling at high filtration velocities.

References

    1. Asari A, Miyauchi S, Matsuzaka S, Ito T, Kominami E, Uchiyama Y. Molecular weight-dependent effects of hyaluronate on the arthritic synovium. Arch Histol Cytol. 1998;61:125–135. - PubMed
    1. Barry SI, Gowman LM, Ethier CR. Obtaining the concentration-dependent diffusion coefficient from ultrafiltration experiments: application to hyaluronate. Biopolymers. 1996;39:1–11.
    1. Blatt WF, Dravid A, Michaels AS, Nelsen L. Solute polarization and cake formation in membrane ultrafiltration: causes, consequences and control techniques. In: Flinn JE, editor. Membrane Science and Technology. New York: Plenum Press; 1970. pp. 47–95.
    1. Brown TJ, Alcorn D, Fraser JRE. Absorption of hyaluronan applied to the surface of intact skin. J Invest Dermatol. 1999;113:740–746. - PubMed
    1. Brown TJ, Laurent UBG, Fraser JRE. Turnover of hyaluronan in synovial joints: elimination of labelled hyaluronan from the knee joint of the rabbit. Exp Physiol. 1991;76:125–134. - PubMed

Publication types

Substances

LinkOut - more resources