. 2004 Jun 15;557(Pt 3):889-907.
doi: 10.1113/jphysiol.2003.058255. Epub 2004 Apr 8.

Oncotic pressures opposing filtration across non-fenestrated rat microvessels

Affiliations

Oncotic pressures opposing filtration across non-fenestrated rat microvessels

R H Adamson et al. J Physiol. .

Abstract

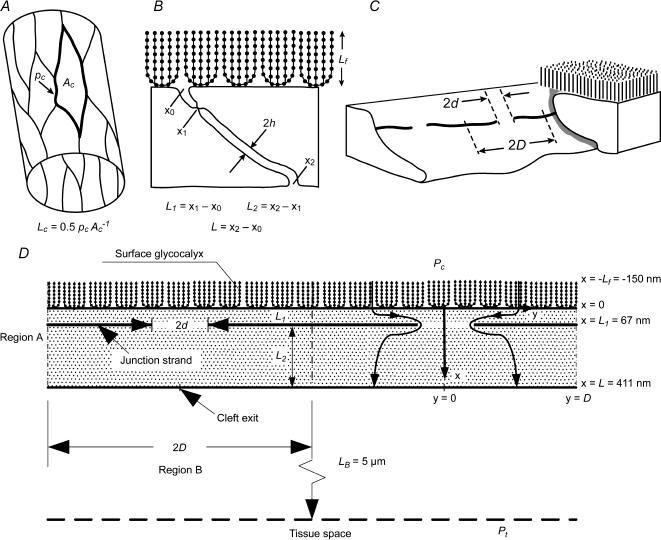
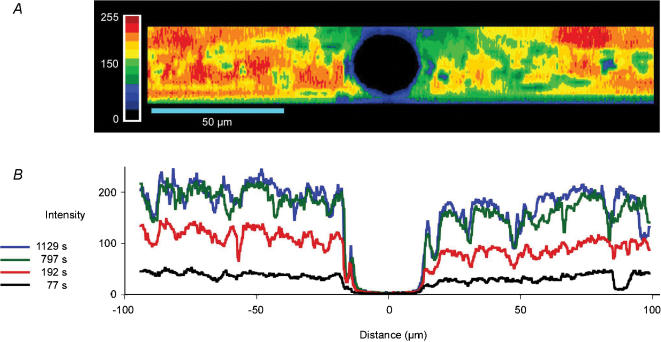
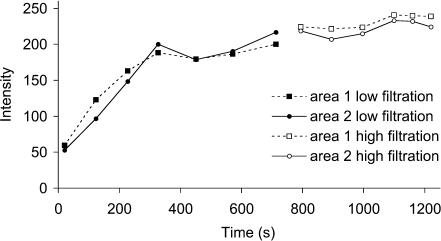
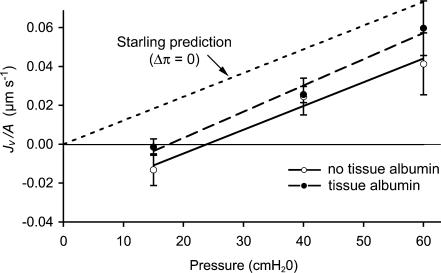
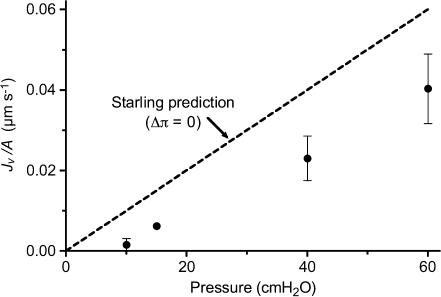
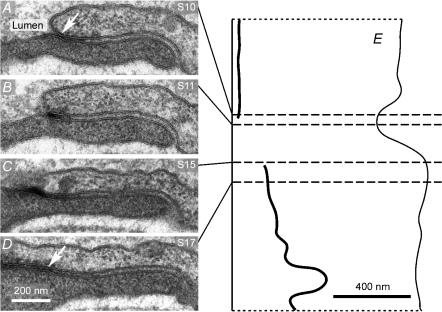
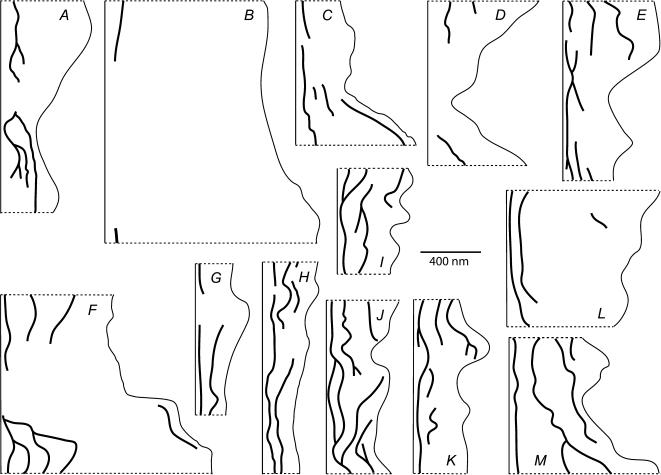
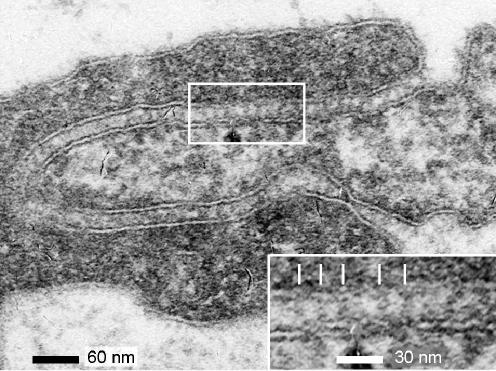
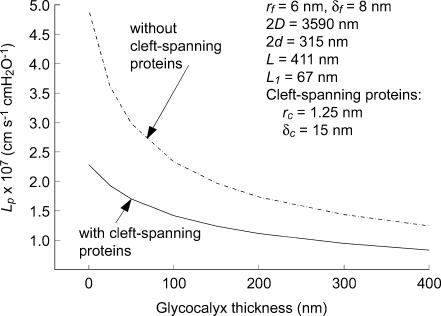
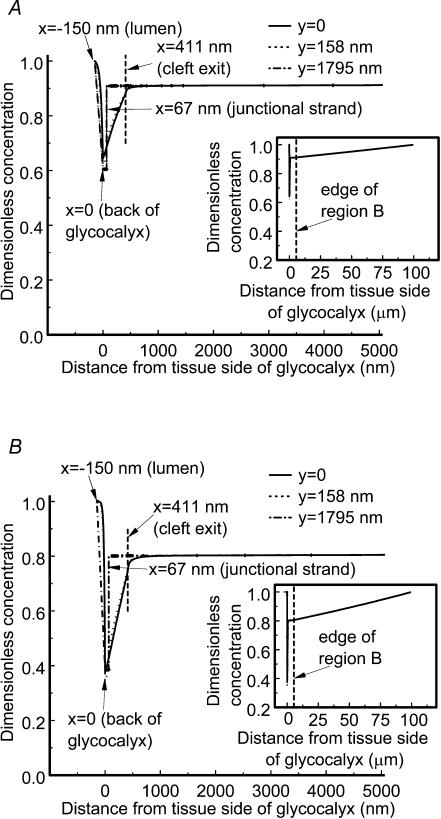
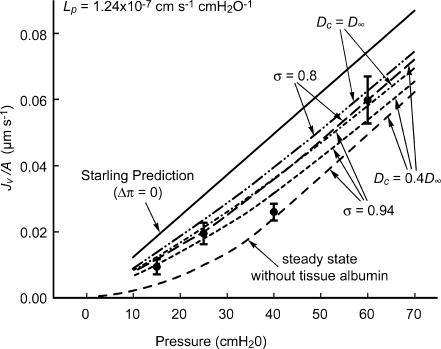
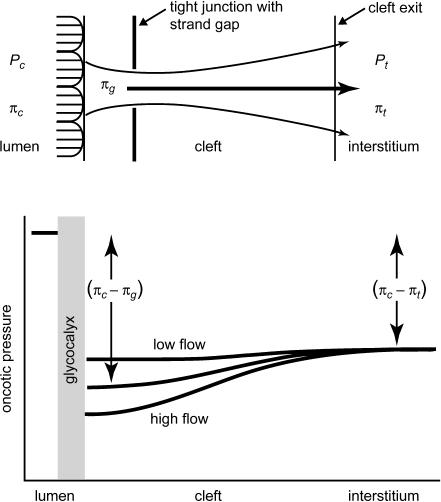
We hypothesized that ultrafiltrate crossing the luminal endothelial glycocalyx through infrequent discontinuities (gaps) in the tight junction (TJ) strand of endothelial clefts reduces albumin diffusive flux from tissue into the 'protected region' of the cleft on the luminal side of the TJ. Thus, the effective oncotic pressure difference (sigma black triangle down pi) opposing filtration is greater than that measured between lumen and interstitial fluid. To test this we measured sigma black triangle down pi across rat mesenteric microvessels perfused with albumin (50 mg ml(-1)) with and without interstitial albumin at the same concentration within a few micrometres of the endothelium as demonstrated by confocal microscopy. We found sigma black triangle down pi was near 70% of luminal oncotic pressure when the tissue concentration equalled that in the lumen. We determined size and frequency of TJ strand gaps in endothelial clefts using serial section electron microscopy. We found nine gaps in the reconstructed clefts having mean spacing of 3.59 microm and mean length of 315 nm. The mean depth of the TJ strand near gaps was 67 nm and the mean cleft path length from lumen to interstitium was 411 nm. With these parameters our three-dimensional hydrodynamic model confirmed that fluid velocity was high at gaps in the TJ strand so that even at relatively low hydraulic pressures the albumin concentration on the tissue side of the glycocalyx was significantly lower than in the interstitium. The results conform to the hypothesis that colloid osmotic forces opposing filtration across non-fenestrated continuous capillaries are developed across the endothelial glycocalyx and that the oncotic pressure of interstitial fluid does not directly determine fluid balance across microvascular endothelium.


Figures

Figure 1
Figure 1. Measured parameters and geometric model of the endothelial cleft
Diagrams illustrating measurement parameters used to construct mathematical model. A, area (Ac) and perimeter (pc) measurements of individual cells seen in silver-stained whole mounts of venular microvessels were used to calculate cleft length per unit area, Lc. B, from each electron microscopic image the cleft depth, L, was measured along the contour between facing cells from the luminal cleft opening (x0) to the abluminal cleft exit (x2). The total distance from lumen to interstitium through the cleft is the sum of L1, the distance to the tight junction strand (x1) from luminal cleft entrance, and L2, the distance from tight junction strand to the abluminal cleft exit. The cleft width is the distance between the outer leaflets of the cell membranes of the two facing cells. Lf, depth of the glycocalyx as determined by Squire et al. (2001). C, oblique view of cleft segment reconstructed from serial sections illustrates the length of tight junction strand gaps, 2d, and the mean distance between strand gap centres, equal to the functional unit length, 2D. D, the idealized diagram representing the mathematical model with values for the cleft and glycocalyx incorporating results of the present study and literature values as given in Table 1. Pc, hydraulic pressure in the vessel lumen; Pt, hydraulic pressure in the interstitium; LB, radius of the near-field region; dimension x corresponds to orientation of cleft depth, L; dimension y corresponds to orientation of cleft length, Lc; dimension z (perpendicular to plane of diagram) corresponds to orientation of cleft width, 2h; other parameters as above.
Figure 2
Figure 2. Loading the interstitium with serum albumin
A, fluorescence image of a microvessel oriented transversely to the vessel axis collected 912 s after adding fluorescent albumin to the superfusate (at top). The vessel (centre, dark) was perfused with non-fluorescent solution. Serum albumin was able to penetrate throughout the interstitial space. B, intensity profiles taken along the centreline of images such as in A at various times demonstrate that the concentration of albumin near the vessel wall reaches steady state by about 13 min.
Figure 3
Figure 3. Interstitial albumin loading not diminished by high filtration from vessel
Fluorescence intensity was recorded from two locations within 5 μm of a vessel wall and monitored over time during perfusion near 20 cmH2O. After raising the luminal hydraulic pressure to 60 cmH2O the intensity did not decrease indicating that interstitial albumin concentration was high during both low and high filtration states.
Figure 4
Figure 4. Effective oncotic pressure remains high in the presence of high extravascular albumin
Filtration flux, Jv/A, as a function of microvessel hydrostatic pressure during perfusion with BSA (50 mg ml−1) was measured in this vessel first with protein-free Ringer superfusate (○) and then with superfusate also containing BSA at the same concentration •). Intercept on the pressure axis indicates the effective oncotic pressure and shows that when interstitial albumin is present at the same concentration as in the perfusate the effective oncotic pressure is greatly different from the expected value of zero (line of Starling prediction).
Figure 5
Figure 5. Steady state filtration at multiple pressures
Filtration flux, Jv/A, as a function of microvessel hydrostatic pressure was measured after having established steady-state conditions at each indicated intraluminal pressure. The superfusate contained BSA at the same concentration as the perfusate (50 mg ml−1). Values shown are means ± s.e.m. for 4 vessels. The relationship expected based on the lack of a protein osmotic pressure difference between perfusate and interstitial fluid is also shown (Starling prediction).
Figure 6
Figure 6. Tight junction strand gap seen in electron micrographs from serial sections
Four sections from a serial run of 30 sections are shown. A, all sections up to and including sections 10 (S10) included a continuous tight junction (arrow) occluding the cleft. B, section 11 (S11) had no tight junction. C, section 15 (S15) had no tight junction. D, section 17 (S17) and all subsequent sections had a tight junction (arrow) that could be traced from one section to the next. E, reconstruction of the tight junction strand illustrated in A–D. Heavy line is tight junction strand, light lines are luminal and abluminal cleft entrances. Dotted lines represent beginning and ending section edges. Section locations on reconstruction shown by dashed lines.
Figure 7
Figure 7. Reconstructions of tight junction strands
A–H, eight additional reconstructions of clefts exhibiting discontinuous tight junction strands. I–M, reconstructions of clefts with no strand gaps for comparison. Luminal entrances are shown as straight light line at left of each reconstruction and abluminal exits are at right. Dotted lines represent beginning and ending section edges. Heavy lines represent tight junction strands.
Figure 8
Figure 8. Cross-bridging structures in the endothelial cleft
Electron dense structures spanning the space between endothelial cells were seen in segments of several clefts. They are apparent in the abluminal part of this cleft (rectangle). Inset, same region at higher magnification with structures marked (arrows).
Figure 9
Figure 9. Model predictions of Lp with and without cleft-spanning structures
Predicted Lp based on the measured parameters described in the text and listed in Table 1. The cleft-spanning structures contribute about 50% of the hydraulic resistance for all values of glycocalyx thickness.
Figure 10
Figure 10. Model prediction of steady-state BSA concentration gradient during low and high filtration
Dimensionless concentration profiles from the lumen into the tissue are shown for a path through the centre of a strand gap (y = 0, continuous line), the edge of a strand gap (y = 158 nm, dashed line) and across the tight junction equidistant between two strand gaps (y = 1795 nm, dashed–dotted line). Lf is assumed to be 150 nm, other values are as in Fig. 9 with cleft-spanning structures. A, with Pc 30 cmH2O, protein concentration at the abluminal side of the glycocalyx is reduced by 40% from its value in the lumen and the superfusate. Concentration on the tissue side of the cleft is low near the strand gap and rises toward the tissue. Inset, concentration just outside the cleft is only 10% reduced from the steady-state value in the lumen and the superfusate. B, at high pressure, with Pc= 60 cmH2O, the protein concentration on the abluminal side of the glycocalyx is reduced by 65% from the luminal value. Inset, even at high Pc the protein concentration just outside the cleft is reduced by only 20% from the value in superfusate.
Figure 11
Figure 11. Model prediction of steady-state filtration relationship
Jv/A is plotted as a function of microvessel hydrostatic pressure for steady-state filtration at each pressure. Model values are predicted from geometric parameters as in Fig. 10 and correspond to an Lp of 1.24 × 10⁻⁷ cm s−1 cmH2O−1. The classic Starling equation predicts no oncotic pressure difference when albumin concentration is 50 mg ml−1 in both lumen and tissue (continuous line). The absence of tissue albumin predicts maximal reduction of Jv/A (lowest dashed curve). Predictions of present model when albumin concentration is 50 mg ml−1 in both lumen and tissue are shown for effective albumin diffusion coefficient within the cleft (Dc) equal to the free solution diffusion coefficient (D) and 0.4D, and also for reflection coefficients for albumin (σ) of 0.8 and 0.94. Steady-state data are shown from a representative microvessel experiment which had Lp of 1.34 × 10⁻⁷ cm s−1 cmH2O−1 and σ equal to 0.93 (•; mean ± s.e.m. of 5–7 measurements at each pressure).
Figure 12
Figure 12. Proposed model for the effective oncotic pressure in a filtering microvessel
The effective oncotic pressure difference determining fluid balance in filtering microvessels is greater when calculated using the oncotic pressure in the subglycocalyx region rather than the mixed interstitial fluid. See Discussion for details.

Comment in

Similar articles

Cited by

References

    1. Adamson RH. Permeability of frog mesenteric capillaries after partial pronase digestion of the endothelial glycocalyx. J Physiol. 1990;428:1–13. - PMC - PubMed
    1. Adamson RH, Curry FE, Adamson G, Liu B, Jiang Y, Aktories K, Barth H, Daigeler A, Golenhofen N, Ness W, Drenckhahn D. Rho and rho kinase modulation of barrier properties: cultured endothelial cells and intact microvessels of rats and mice. J Physiol. 2002;539:295–308. - PMC - PubMed
    1. Adamson RH, Lenz JF, Curry FE. Quantitative laser scanning confocal microscopy on single capillaries: permeability measurement. Microcirculation. 1994;1:251–265. - PubMed
    1. Adamson RH, Michel CC. Pathways through the intercellular clefts of frog mesenteric capillaries. J Physiol. 1993;466:303–327. - PMC - PubMed
    1. Aukland K, Reed RK. Interstitial-lymphatic mechanisms in the control of extracellular fluid volume. Physiol Rev. 1993;73:1–78. - PubMed

Publication types

MeSH terms