. 2004 Jun;15(6):2978-91.
doi: 10.1091/mbc.e03-08-0613. Epub 2004 Apr 9.

The adenomatous polyposis coli protein is required for the formation of robust spindles formed in CSF Xenopus extracts

Affiliations

The adenomatous polyposis coli protein is required for the formation of robust spindles formed in CSF Xenopus extracts

Dina Dikovskaya et al. Mol Biol Cell. 2004 Jun.

Abstract

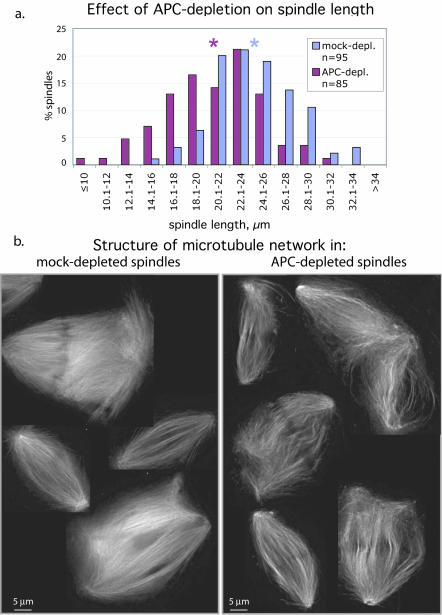
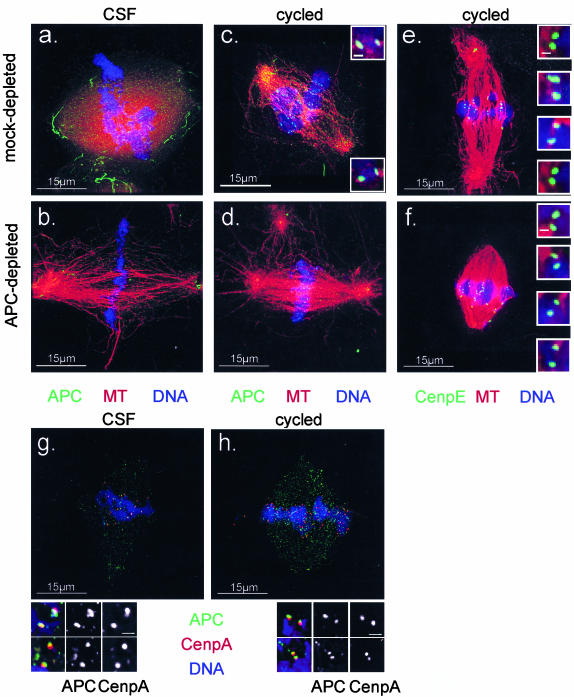
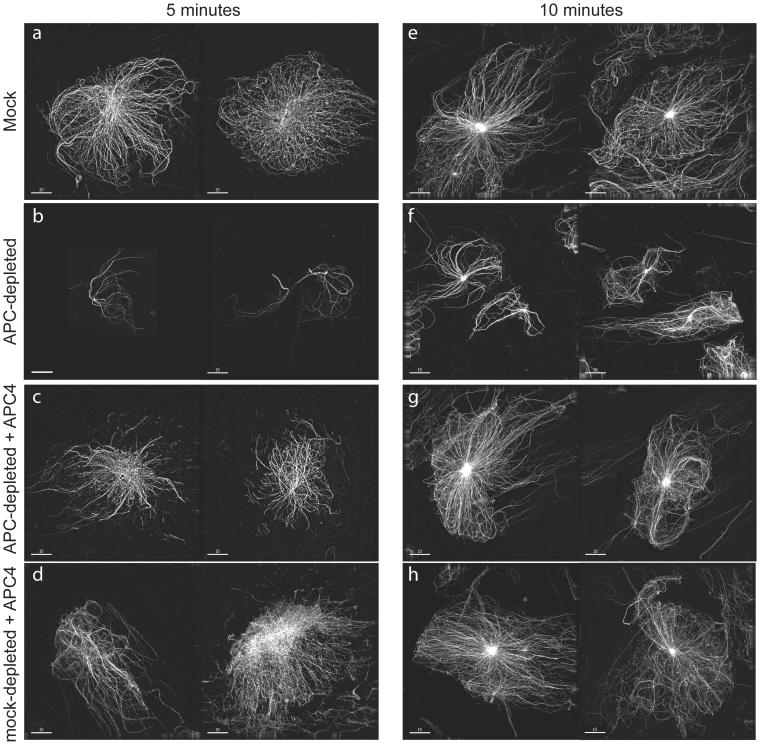
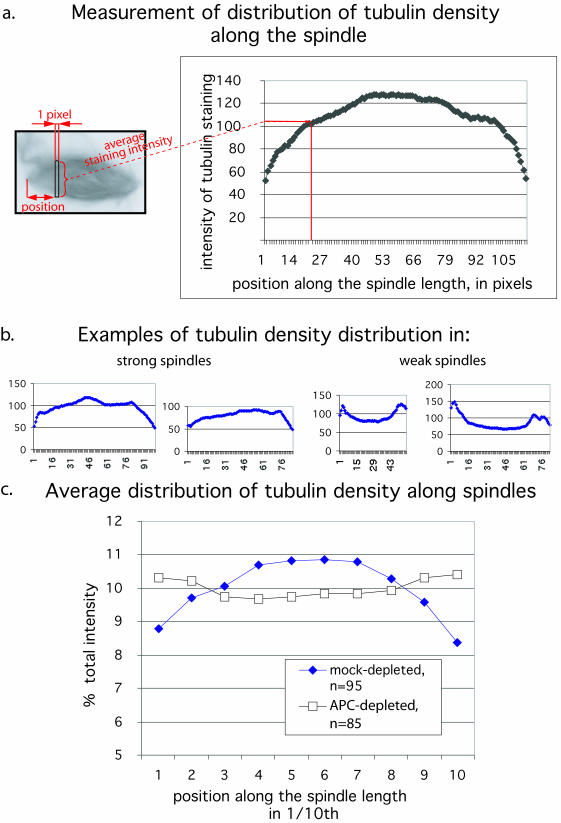
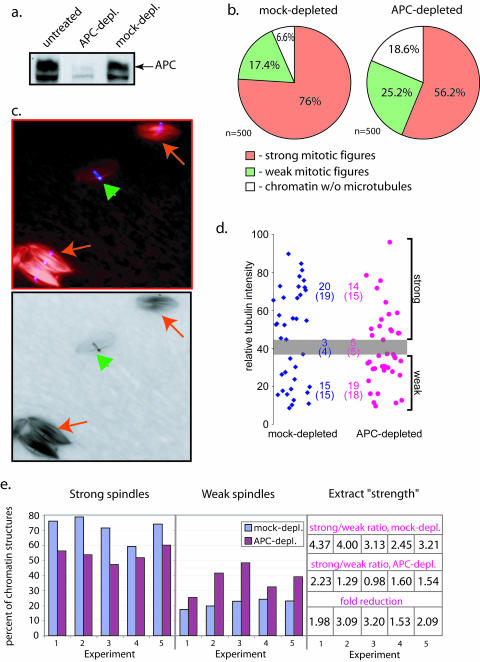
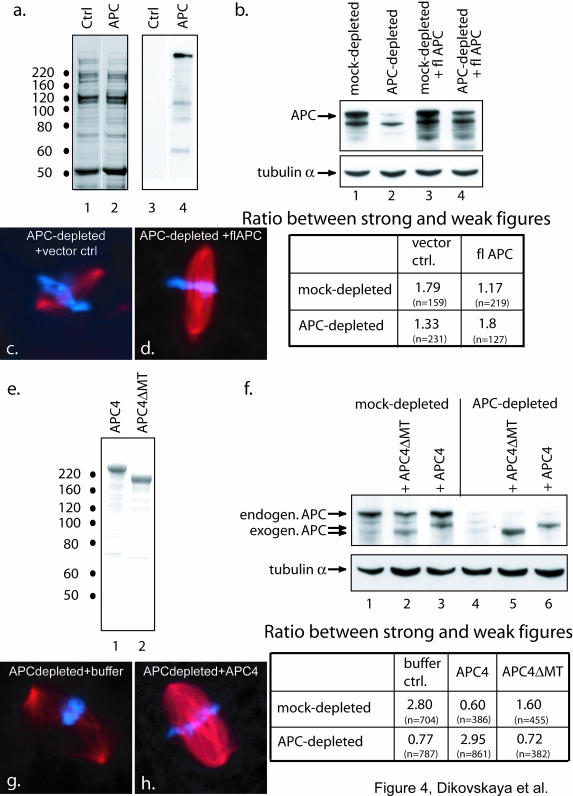
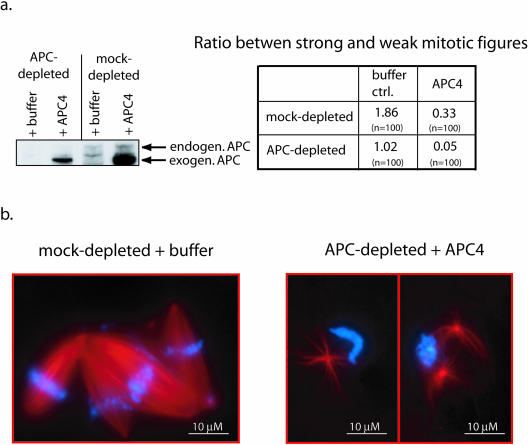
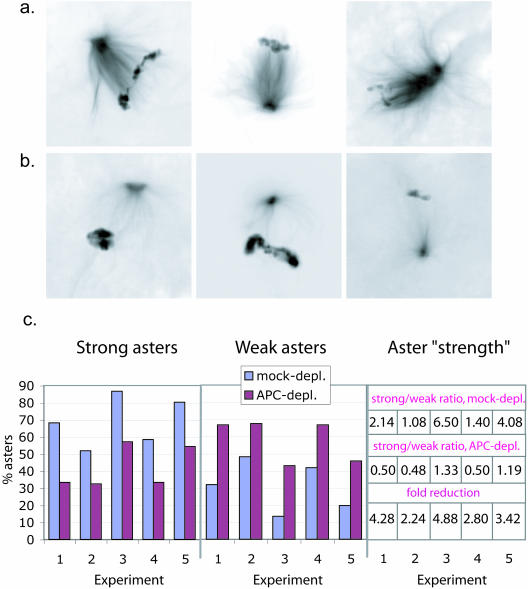
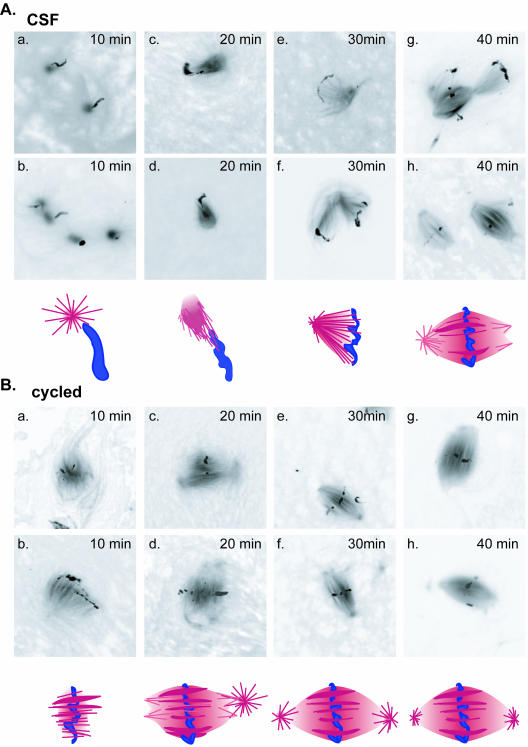
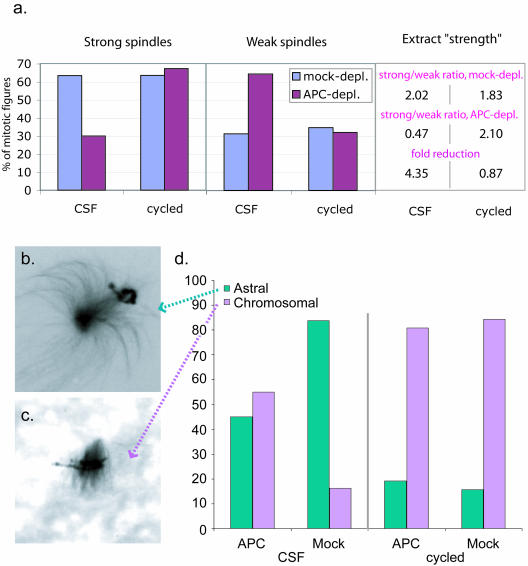
Mutations in the adenomatous polyposis coli (APC) protein occur early in colon cancer and correlate with chromosomal instability. Here, we show that depletion of APC from cystostatic factor (CSF) Xenopus extracts leads to a decrease in microtubule density and changes in tubulin distribution in spindles and asters formed in such extracts. Addition of full-length APC protein or a large, N-terminally truncated APC fragment to APC-depleted extracts restored normal spindle morphology and the intact microtubule-binding site of APC was necessary for this rescue. These data indicate that the APC protein plays a role in the formation of spindles that is dependent on its effect on microtubules. Spindles formed in cycled extracts were not sensitive to APC depletion. In CSF extracts, spindles predominantly formed from aster-like intermediates, whereas in cycled extracts chromatin was the major site of initial microtubule polymerization. These data suggest that APC is important for centrosomally driven spindle formation, which was confirmed by our finding that APC depletion reduced the size of asters nucleated from isolated centrosomes. We propose that lack of microtubule binding in cancer-associated mutations of APC may contribute to defects in the assembly of mitotic spindles and lead to missegregation of chromosomes.


Figures

Figure 2.
Figure 2.
Removal of APC affects spindle length and fine structure of microtubule network. (a) Pole-to-pole distance was measured in spindles formed in mock- or APC-depleted extracts. The histogram represents the distribution of spindles according to their length in micrometers. Stars mark the average spindle length for each type of extract. (b) Single optical sections (0.2 μm) of microtubules in spindles formed in mock- and APC-depleted extracts (as indicated) revealed less tightly packed and curved microtubule bundles in spindles formed in the absence of APC.
Figure 6.
Figure 6.
APC localizes to mitotic spindles and kinetochores in Xenopus extracts. Spindles were prepared in mock (a, c, e, g, and h) or APC-depleted (b, d, and f) CSF (a, b, and g) or cycled (c, e, d, f, and h) extracts and sedimented onto coverslips before fixing and staining with DAPI (blue) and antibodies against APC (indicated in green) (a–d, g and h), CenpE (e and f), or CenpA (g and h) as indicated. Tubulin is shown in red. Images were collected using a DeltaVision restoration microscope and represent volume projections of the entire spindle thickness. Images of mock- and APC-depleted spindles from the same extracts (a–d) were collected using identical settings for the image collections and processing. Insets in c, e, f, g, and h represent single 0.2-μm optical sections. APC was enriched at spindle poles but also decorated the entire microtubule lattice. In addition, APC accumulated in dot-like structures that are paired in cycled spindles and resemble kinetochores labeled with CenpE antibodies (e and f). APC in these structures costained with antibodies against CenpA (g and h). As expected, staining was significantly reduced after APC-depletion. Bar in insets, 0.5 μm (c, e, and f) and 1 μm (g and h).
Figure 8.
Figure 8.
Depletion of APC compromises the formation of asters. Asters nucleated from isolated centrosomes in mock-depleted (a, d, e, and h) or APC-depleted (b, c, f, and g) CSF extracts that did (c, d, g, and h) or did not contain APC4 (a, b, e, and f) as indicated, were sedimented onto glass coverslips 5 (a–d) or 10 min (e–h) after initiation of tubulin polymerization. Asters were imaged using a DeltaVision restoration microscope. Images of two examples of typical asters obtained in the indicated conditions are shown. APC depletion reduced aster size, and this effect was rescued by addition of the APC4 fragment. Bar, 15 μm.
Figure 3.
Figure 3.
Distribution of tubulin in mitotic spindles is altered by APC-depletion. Spindles were allowed to form in APC- or mock-depleted extracts in the presence of rhodamine-labeled tubulin. Fluorescent images of tubulin in the spindles were captured and analyzed in the following manner. (a) Each spindle image was scanned along its length from one pole to another, and the average intensity of tubulin staining in a slice across the spindle axis was taken at each pixel position. This intensity was plotted against position along the pole-to-pole axis for each slice. (b) Examples of individual measurements performed as in panel a are shown for strong and weak spindles. These examples show the raw data without normalization for length or overall spindle intensity. c) Measurements were performed as described in panel a by using 95 randomly selected mock-depleted (blue diamonds) and 85 APC-depleted (white squares) spindles. Intensities in each segment along the spindle axis were normalized to overall mean spindle intensity and these values were plotted against relative position along the pole-to-pole axis.
Figure 1.
Figure 1.
APC depletion weakens mitotic spindles in Xenopus egg extract. (a) Immuno blotting of Xenopus egg extract, either untreated or immunodepleted with affinity-purified anti-APC antibody or rabbit IgG as indicated, shows significant depletion of APC only when anti-APC antibody was used. We always detected three bands in Xenopus egg extracts that are reactive with our anti-APC antibody. Only the upper band was also detected by other APC antibodies. This band has the correct size and is therefore considered to represent full-length APC. The middle band seems to be partially removed during APC depletion, whereas the bottom band does not change after depletion. (b) The proportions of strong (orange) and weak (green) mitotic figures (bipolar spindles and asters) and microtubule-free-chromatin (white) found in mock- and APC-depleted extracts were measured using 500 nuclei for each extract condition. APC depletion resulted in a decrease in the proportion of strong mitotic figures compared with mock-depleted control. These data corresponds to experiment 1 in e. (c) Examples of spindles formed in Xenopus egg extract in the presence of sperm nuclei chromatin (blue) and rhodamine-labeled tubulin (red) reflect the heterogeneity in the types of spindles found even in untreated extracts. High intensity (strong, red arrows) and low intensity (weak, green arrowhead) spindles were found next to each other in the optical field, reflecting the natural variability in the microtubule content of such spindles. (d) Images of a randomly selected set of spindles collected from mock- or APC-depleted extracts were recorded and the total tubulin intensity was measured using NIH Image software. The scatter chart represents the mean tubulin intensities of individual spindles found in mock-depleted (blue) and APC-depleted (pink) extracts. These spindles were independently scored visually as described in Figure 1b (numbers in brackets) and the gray zone depicts the range of intensities of those spindles that were scored as ambiguous by the visual examination. Using this zone to define a threshold, strong and weak spindle populations could be counted based on their measured intensities and these are shown in the chart (upper numbers). Note that the numbers obtained by these two methods are practically identical. (e) This diagram shows the proportion of strong (left) and weak (middle) spindles in mock- (blue) and APC-depleted (purple) extracts from five independent experiments. Extract strength was calculated as a ratio between strong and weak mitotic figures formed in the extracts as shown on the table. Fold reduction of extract strength from mock-depleted to corresponding APC-depleted extracts provides a numeric representation of the weakening of spindles upon APC depletion (lower line). This allows a direct comparison of a number of independent experiments. The fold reduction was reproducibly larger than 1, and averaged 2.37 ± 0.73, indicating that APC depletion always produced weaker spindles, independently of the initial strength of the extract. For each experiment, 300–500 spindles were scored for mock- and APC-depleted samples.
Figure 4.
Figure 4.
The ability of recombinant APC to rescue APC-depleted extracts requires the major microtubule-binding site of APC. Spindles were formed in APC-depleted or mock-depleted extracts supplemented with the indicated APC proteins or control buffer. The number of strong and weak mitotic figures was counted and the ratio between them was calculated for each extract condition. The number of spindles counted for each condition is indicated in brackets. (a) Fractions from SF21 cells that had been infected with either baculovirus encoding His-tagged full-length APC (lanes 2 and 4) or control vector (lanes 1 and 3) were eluted from Ni2+-agarose and subjected to SDS gel electrophoresis. Gels were stained with Coomassie (lanes 1 and 2) or blotted to membranes and probed with a mouse monoclonal anti-APC antibody (lanes 3 and 4). b) Immunoblot of mock- (lanes 1 and 3) or APC-depleted (lanes 2 and 4) extracts after addition of fractions containing either vector control (lanes 1 and 2) or full length APC (lanes 3 and 4) was performed using antibodies against APC. This confirmed that the amount of full-length APC added was slightly below that of endogenous APC. Tubulin antibodies were used to verify equal loading. The table summarizes the ratio between strong and weak mitotic figures for each extract condition. Note that addition of APC to APC-depleted extracts restores this ratio to that of mock-depleted extracts to which control buffer had been added. Note also that addition of APC to mock-depleted extracts weakened spindles. (e) Coomassie-stained gel of 1 μg of purified APC4 and 0.6 μg of APC4ΔMT. (f) Immunoblot (top) of mock- or APC-depleted extracts as indicated, supplemented with APC4 (lane 3 and 6), APC4ΔMT (lane 2 and 5) to bring the final protein concentration of exogenous APC to 0.5 ng/μl, or control buffer (lane 1 and 4), were probed with anti-APC antibody to confirm that the amount of APC4 that was added was similar to that of endogenous APC. Antibodies against α-tubulin were used on the same blot to confirm equal protein loading. The table (bottom) shows the ratio between strong and weak mitotic figures for each combination revealing that addition of APC4 but not APC4ΔMT rescued the effect of APC depletion. Note that addition of APC4 to mock-depleted extracts caused a significant decrease in spindle strength. (c, d, g, and h) Images of spindles from the experiments outlined above illustrate the effect of fl-APC (d) or APC4 (h) on the morphology of spindles formed in APC-depleted extracts (c and g).
Figure 5.
Figure 5.
Excess APC is deleterious for spindle formation. (a) Immunoblot (left) of APC- (lanes 1 and 2) or mock-depleted (lanes 3 and 4) extracts after addition of a 4–5 fold excess of APC4 over level of endogenous APC (∼2.3 ng/μl final concentration) (lane 2 and 4) or buffer alone (lane 1 and 3) using APC antibodies. The table on the right shows the ratio between strong and weak mitotic figures for each condition. Addition of an excess of APC4 results in significant weakening of spindles in both mock and APC-depleted extracts. (b) Representative examples of mitotic figures from the experiment shown in a. In APC-depleted extracts supplemented with APC4 in four- to fivefold excess of endogenous APC, most spindles were abnormal and contained very little tubulin compared with the robust, strong spindles that predominated in the control extracts.
Figure 7.
Figure 7.
Depletion of APC results in defects in asters. Asters formed in mock- and APC-depleted Xenopus CSF extracts in the presence of sperm nuclei were scored as strong (a) or weak (b) based on general tubulin intensity (exactly as in Figure 1). (c) The proportion of strong asters was significantly reduced in extracts after APC depletion. The bar diagram shows the proportion of strong (left) and weak (middle) asters in mock- (blue) and APC-depleted (purple) extracts in 5 independent experiments. Aster “strength” was calculated as the ratio between strong and weak asters and is shown in the table on the right. Fold reduction of the aster strength from mock-depleted to corresponding APC-depleted extracts (lower line) was reproducibly greater than 1, average 3.52 ± 1.07, indicating that APC depletion had a robust weakening effect on asters.
Figure 10.
Figure 10.
Formation of spindles in CSF and cycled extracts proceeds via different intermediates. Spindle formation was initiated in CSF (A) or cycled (B) extracts and microtubule structures examined every 10 min. Two examples of typical assemblies at each time point are displayed with a schematic representation of each of the intermediates shown below the corresponding images. In CSF extracts early intermediates were represented by asters that formed in the vicinity of chromatin and consisted of microtubules emanating from well focused points. By 20 min, these asters polarized toward the chromatin to form half spindles by 30 min. In cycled extracts, early intermediates were formed by chromatin from which microtubules emanated in parallel arrays. These arrays then reorganized to become more focused at their distal ends to form spindles.
Figure 9.
Figure 9.
APC does not affect cycled spindle strength. (a) Spindles were formed in APC- and mock-depleted CSF or cycled extracts. The number of strong and weak spindles was counted as described for Figure 1. The histogram represents the % of strong and weak figures. Extract strength and fold reduction calculated as in Figure 1 are shown in the Table on the right. (b). Image of a typical “astral” and “chromosomal”(c) early mitotic figure. (d). The relative proportion of astral and chromosomal early mitotic figures are indicated for APC- and mock-depleted extracts before and after cycling. The y-axis represents the percent mitotic figures. In CSF extracts, astral figures predominated and APC depletion resulted in a reduction in their relative abundance. In cycled extracts, on the other hand, chromosomal asters were predominant, and APC depletion did not affect this distribution.

References

    1. Bienz, M., and Clevers, H. (2000). Linking colorectal cancer to Wnt signaling. Cell 103, 311-320. - PubMed
    1. Boland, C.R., and Kim, Y.S. (1993). Gastrointestinal polyposis syndromes. In: Gastrointestinal Disease, ed. M.H. Sleisinger and J.S. Fordtran, Philadelphia: WB Saunders, 1430-1436.
    1. Carazo-Salas, R.E., and Karsenti, E. (2003). Long-range communication between chromatin and microtubules in Xenopus egg extracts. Curr. Biol. 13, 1728-1733. - PubMed
    1. Deka, J., Kuhlmann, J., and Muller, O. (1998). A domain within the tumor suppressor protein APC shows very similar biochemical properties as the microtubule-associated protein tau. Eur. J. Biochem. 253, 591-597. - PubMed
    1. Desai, A., Murray, A.W., Mitchison, T.J., and Walczak, C.E. (1999). The use of Xenopus egg extracts to study mitotic spindle assembly and function in vitro. Methods Cell Biol. 61, 385-412. - PubMed

Publication types

LinkOut - more resources