. 2004 Jun;15(6):2943-53.
doi: 10.1091/mbc.e03-10-0745. Epub 2004 Apr 9.

Vascular endothelial-cadherin regulates cytoskeletal tension, cell spreading, and focal adhesions by stimulating RhoA

Affiliations

Vascular endothelial-cadherin regulates cytoskeletal tension, cell spreading, and focal adhesions by stimulating RhoA

Celeste M Nelson et al. Mol Biol Cell. 2004 Jun.

Abstract

Changes in vascular endothelial (VE)-cadherin-mediated cell-cell adhesion and integrin-mediated cell-matrix adhesion coordinate to affect the physical and mechanical rearrangements of the endothelium, although the mechanisms for such cross talk remain undefined. Herein, we describe the regulation of focal adhesion formation and cytoskeletal tension by intercellular VE-cadherin engagement, and the molecular mechanism by which this occurs. Increasing the density of endothelial cells to increase cell-cell contact decreased focal adhesions by decreasing cell spreading. This contact inhibition of cell spreading was blocked by disrupting VE-cadherin engagement with an adenovirus encoding dominant negative VE-cadherin. When changes in cell spreading were prevented by culturing cells on a micropatterned substrate, VE-cadherin-mediated cell-cell contact paradoxically increased focal adhesion formation. We show that VE-cadherin engagement mediates each of these effects by inducing both a transient and sustained activation of RhoA. Both the increase and decrease in cell-matrix adhesion were blocked by disrupting intracellular tension and signaling through the Rho-ROCK pathway. In all, these findings demonstrate that VE-cadherin signals through RhoA and the actin cytoskeleton to cross talk with cell-matrix adhesion and thereby define a novel pathway by which cell-cell contact alters the global mechanical and functional state of cells.


Figures
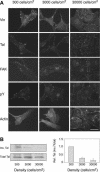
Figure 1.
Figure 1.
Density modulates FA formation. (A) Fluorescence images of cells seeded at different densities and stained for FA components, vinculin (vin), talin (tal), FAK, and phosphotyrosine (pY), or actin. Bar, 25 μm. (B) Western blot for Triton X-100 insoluble fraction (ins.) and total talin at different seeding densities (left). Graph of relative talin in FA (ins./total) at different seeding densities (right). Error bars indicate SD of three independent experiments.
Figure 2.
Figure 2.
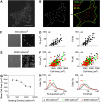
Cell-cell contact decreases cell spreading and FA formation. (A) Fluorescence image of cell stained for vinculin. Bar, 25 μm. (B) Black/white image of vinculin fluorescence of cell in A after processing (left), with cell area (green), FA area (red), and FA number (yellow) indicated for that cell (right). (C) Phase contrast (left) and fluorescence images (right) of cells seeded at 300 cells/cm2 and stained with TRITC-conjugated phalloidin. Bar, 200 μm. (D) Dot plots of total FA area (left) and number (right) as a function of cell spreading for cells plated at a low density. (E) Phase contrast (left) and fluorescence images (right) of cells seeded at 30,000 cells/cm2 and stained with TRITC-conjugated phalloidin. Bar, 200 μm. (F) Dot plots of total FA area (left) and number (right) as a function of cell spreading for cells plated at seeding densities of 300 (black), 3000 (green), and 30,000 (red) cells/cm2. (G) Graph of cell spreading as a function of seeding density. Error bars indicate range of two independent experiments. (H) Histogram graphs of total FA area (left) and number (right) for cells plated at different seeding densities. *p < 0.05, **p < 0.005 between cells cultured at 3000 (green) or 30,000 (red) cells/cm2 compared with cells at 300 cells/cm2 as calculated by nonparametric median test.
Figure 3.
Figure 3.
Density-dependent engagement of VE-cadherin decreases endothelial cell spreading. (A) Western blot for VE-cadherin for endothelial cells untreated (control) or infected with Ad-GFP or Ad-VEΔ. (B) Fluorescence images of VE-cadherin (VEcad), β-catenin, connexin 43 (Cx43), and PECAM-1 for cells infected with Ad-GFP or Ad-VEΔ. Bar, 20 μm. (C) Fluorescence images of endothelial cells infected with Ad-GFP or Ad-VEΔ and stained with TRITC-conjugated phalloidin at seeding densities of 300 and 30,000 cells/cm2. Bar, 200 μm. (D) Graph of endothelial cell spreading as a function of seeding density for cells infected with Ad-GFP and Ad-VEΔ. (E) Western blot for VE-cadherin for A431D (null) and A431D-VE (VE+) cell lysates. (F) Fluorescence images of null and VE+ cells stained with TRITC-conjugated phalloidin at 9000 cells/cm2. Bar, 200 μm. (G) Graph of cell spreading as a function of seeding density for null and VE+ cells. Error bars indicate range of two independent experiments.
Figure 4.
Figure 4.
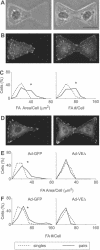
VE-cadherin–mediated cell-cell contact increases FA formation when spreading is controlled. (A) Phase contrast images of a single cell (left) or a pair of cells (right) cultured in the bowtie-shaped microwells. (B) Fluorescence images of a single cell (left) or a pair of cells (right) cultured in the bowtie-shaped microwells and stained for vinculin. (C) Histogram graphs of total FA area (left) and number (right) for vinculin in single cells (dotted lines) and pairs of cells (solid lines). (D) Fluorescence images of vinculin staining in a single cell (left) and a pair of cells (right) infected with Ad-VEΔ and cultured on the bowtie-shaped microwells. Histogram graphs of total area (E) and number (F) of vinculin adhesions for single cells (dotted lines) and pairs of cells (solid lines) infected with Ad-GFP or Ad-VEΔ. Dashed lines (red) indicate borders of wells in B and D. Bar, 25 μm. *p <0.05 as calculated by nonparametric median test.
Figure 5.
Figure 5.
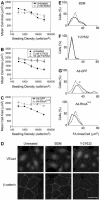
VE-cadherin–induced changes require RhoA-mediated signaling and tension. (A–C) Graph of endothelial cell spreading as a function of seeding density for cells treated with or without BDM (A), Y-27632 (B), or infected with Ad-RhoAN19 or Ad-GFP control (C). Error bars indicate range of two independent experiments. (D) Fluorescence images of untreated, 2 mM BDM-, or 50 μM Y-27632–treated endothelial cells seeded at 30,000 cells/cm2 and stained at 24 h for VE-cadherin or β-catenin. Bar, 20 μm. (E–G) Histogram graphs of total area of vinculin adhesions for single cells (dotted lines) and pairs of cells (solid lines) treated with BDM (E), Y-27632 (F), or infected with Ad-RhoAN19 or Ad-GFP control (G). *p < 0.05 as calculated by nonparametric median test.
Figure 6.
Figure 6.
Engagement of VE-cadherin activates RhoA. (A) Pulldown experiments for GTP-bound RhoA in endothelial cells that were uninfected controls (cntl) or infected with Ad-GFP or Ad-VEΔ and subsequently detached and held in suspension (time 0). As a comparison, adherent monolayers that were serum starved (starve), stimulated for 5 min with media containing 5% serum (stim.), or unstarved controls (cntl) were lysed before detachment (adherent). (B, C, and E) RhoA activity in cells infected with Ad-GFP (B and E) or Ad-VEΔ (C) and replated on fibronectin-coated dishes at 30,000 cells/cm2 (B and C) or 9000 cells/cm2 (E). RhoA was assayed by pull-down experiments at indicated times, and values were normalized relative to time 0. (D) Fluorescence images of Ad-GFP– and Ad-VEΔ–infected cells stained for p120-catenin at different times after plating. Bar, 25 μm. (F) RhoA activity in cells infected with Ad-GFP or Ad-VEΔ, 24 h after replating at 30,000 cells/cm2 on fibronectin-coated substrates. Data are mean ± SE from three or more experiments.
Figure 7.
Figure 7.
Schematic of proposed model. VE-cadherin activates RhoA, which increases intracellular tension, leading to a decrease in cell spreading as well as an increase in FA formation.

References

    1. Abercrombie, M., and Turner, A.A. (1978). Contract reactions influencing cell locomotion of a mouse sarcoma in culture. Med. Biol. 56, 299-303. - PubMed
    1. Alexander, J.S., and Elrod, J.W. (2002). Extracellular matrix, junctional integrity and matrix metalloproteinase interactions in endothelial permeability regulation. J. Anat. 200, 561-574. - PMC - PubMed
    1. Amano, M., Fukata, Y., and Kaibuchi, K. (2000). Regulation and functions of Rho-associated kinase. Exp. Cell Res. 261, 44-51. - PubMed
    1. Anastasiadis, P.Z., and Reynolds, A.B. (2001). Regulation of Rho GTPases by p120-catenin. Curr. Opin. Cell Biol. 13, 604-610. - PubMed
    1. Arregui, C., Pathre, P., Lilien, J., and Balsamo, J. (2000). The nonreceptor tyrosine kinase fer mediates cross-talk between N-cadherin and beta1-integrins. J. Cell Biol. 149, 1263-1274. - PMC - PubMed

Publication types

LinkOut - more resources