. 2004 Apr 20;101(16):6062-7.
doi: 10.1073/pnas.0400782101. Epub 2004 Apr 9.

A gene atlas of the mouse and human protein-encoding transcriptomes

Affiliations

A gene atlas of the mouse and human protein-encoding transcriptomes

Andrew I Su et al. Proc Natl Acad Sci U S A. .

Abstract

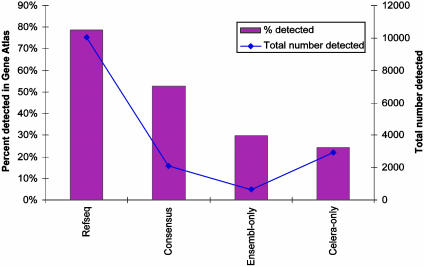
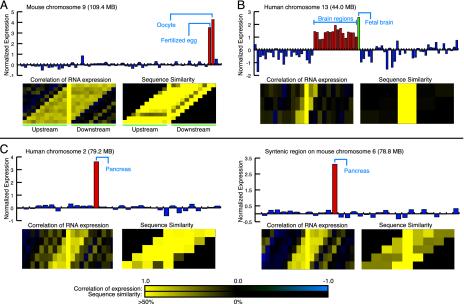
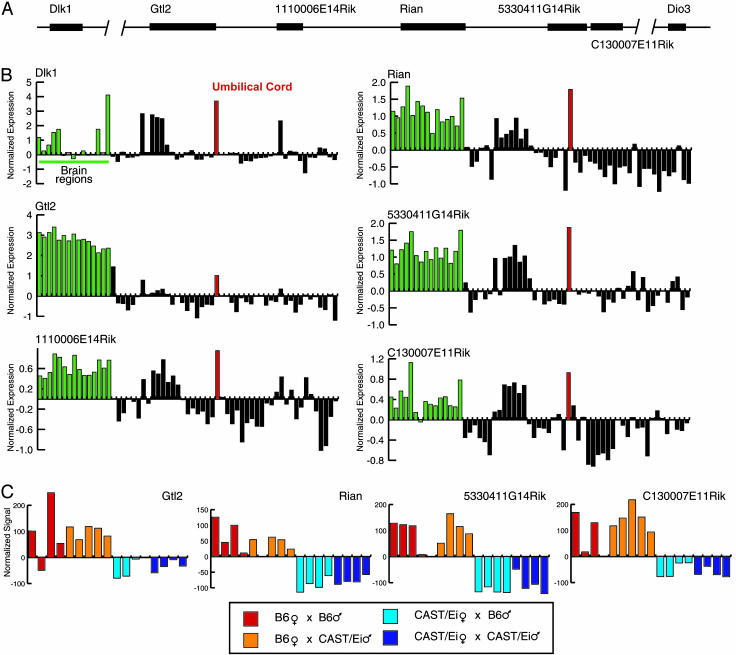
The tissue-specific pattern of mRNA expression can indicate important clues about gene function. High-density oligonucleotide arrays offer the opportunity to examine patterns of gene expression on a genome scale. Toward this end, we have designed custom arrays that interrogate the expression of the vast majority of protein-encoding human and mouse genes and have used them to profile a panel of 79 human and 61 mouse tissues. The resulting data set provides the expression patterns for thousands of predicted genes, as well as known and poorly characterized genes, from mice and humans. We have explored this data set for global trends in gene expression, evaluated commonly used lines of evidence in gene prediction methodologies, and investigated patterns indicative of chromosomal organization of transcription. We describe hundreds of regions of correlated transcription and show that some are subject to both tissue and parental allele-specific expression, suggesting a link between spatial expression and imprinting.


Figures

Fig. 1.
Fig. 1.
Validation of gene predictions in humans. Gene targets on the GNF1H array were divided into four categories: contained in Refseq, predicted by both gene prediction efforts considered (“Consensus”), and predicted by only one group (“Ensembl-only” and “Celera-only”). On the left axis (solid bars), rates of validation are shown, where detectable expression in at least one tissue is taken as evidence of the validity of a gene prediction. The right axis (blue line) indicates the total number of validated genes per group.
Fig. 2.
Fig. 2.
RCT. (A) An RCT was identified on mouse chromosome 9, consisting of 11 genes that share a highly conserved expression pattern. (Upper) The y axis is average normalized expression value, the x axis contains the 61 different tissues, and red bars are fertilized egg and oocytes. The correlation plot (Lower Left) visualizes the pairwise correlation coefficients. Each row represents a gene, ordered vertically according to their position on the chromosome. The center yellow vertical strip represents autocorrelation (R = 1); positions to the right of center represent correlation of the gene to its downstream neighbors, whereas positions to the left represent correlation to the upstream neighbors. Yellow indicates high correlation; blue indicates low correlation (scale at bottom). The sequence similarity plot (using tblastx, Lower Right) has the same structure as the correlation plot, except pairwise sequence similarity is shown. In this RCT with high expression levels in fertilized eggs and oocytes, the genes share a high degree of sequence similarity, likely indicating they are all members of a single gene family and the result of one or more gene duplication events. (B) An example RCT is identified on human chromosome 13, which contains three genes with highly correlated expression (red bars are brain regions, green bar is fetal brain). In contrast to the first example, these genes share very little pairwise sequence similarity. (C) An evolutionarily conserved RCT is shown from human chromosome 2 (Left) and the syntenic region on mouse chromosome 6 (Right). These RCTs share a pancreas-enriched expression pattern (red bar), as well as significant sequence similarity.
Fig. 3.
Fig. 3.
Six genes on mouse chromosome 12 share a distinctive pattern of expression. (A) A genomic view of this region (not to scale). Locations of the genes on the mouse genome assembly: Dlk (103.508 Mb), Gtl2 (103.593 Mb), 1110006E14Rik (103.646 Mb), Rian (103.696 Mb), 5330411G14Rik (103.788 Mb), C130007E11Rik (103.798 Mb), and Dio3 (104.328 Mb). (B) These genes share enriched expression in brain regions (green bars) and umbilical cord (red bar). The y axes indicate normalized expression values, whereas each bar along the x axis indicates a sample profiled in our data set. (C) Three of these genes (Dlk1, Gtl2, and Rian) have been previously reported to be imprinted. Using our allele-specific probe expression analysis approach (see text), we confirmed the imprinted regulation of Gtl2 and Rian and report two previously undescribed imprinted transcripts at this locus (5330411G14Rik and C130007E11Rik). The y axes indicate the normalized signal intensity for individual probes on the array, and each bar represents a pooled sample from a cross indicated by color (see key).

References

    1. Venter, J. C., Adams, M. D., Myers, E. W., Li, P. W., Mural, R. J., Sutton, G. G., Smith, H. O., Yandell, M., Evans, C. A., Holt, R. A., et al. (2001) Science 291, 1304-1351. - PubMed
    1. Lander, E. S., Linton, L. M., Birren, B., Nusbaum, C., Zody, M. C., Baldwin, J., Devon, K., Dewar, K., Doyle, M., FitzHugh, W., et al. (2001) Nature 409, 860-921. - PubMed
    1. Su, A. I., Welsh, J. B., Sapinoso, L. M., Kern, S. G., Dimitrov, P., Lapp, H., Schultz, P. G., Powell, S. M., Moskaluk, C. A., Frierson, H. F., Jr., et al. (2001) Cancer Res. 61, 7388-7393. - PubMed
    1. Aza-Blanc, P., Cooper, C. L., Wagner, K., Batalov, S., Deveraux, Q. L. & Cooke, M. P. (2003) Mol. Cell 12, 627-637. - PubMed
    1. Chanda, S. K., White, S., Orth, A. P., Reisdorph, R., Miraglia, L., Thomas, R. S., DeJesus, P., Mason, D. E., Huang, Q., Vega, R., et al. (2003) Proc. Natl. Acad. Sci. USA 100, 12153-12158. - PMC - PubMed

Publication types