. 2004 Apr 22;23(19):3404-13.
doi: 10.1038/sj.onc.1207397.

Krüppel-like factor 5 mediates the transforming activity of oncogenic H-Ras

Affiliations

Krüppel-like factor 5 mediates the transforming activity of oncogenic H-Ras

Mandayam O Nandan et al. Oncogene. .

Abstract

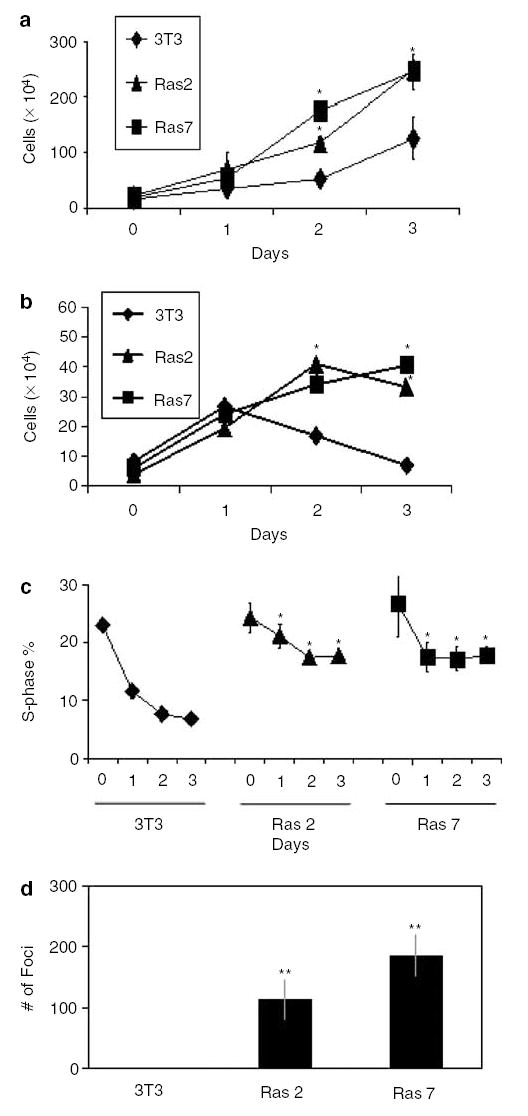
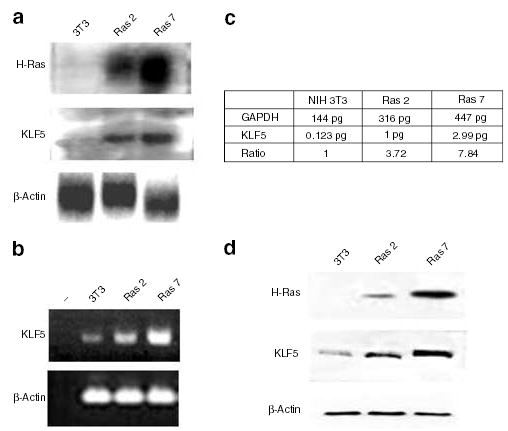
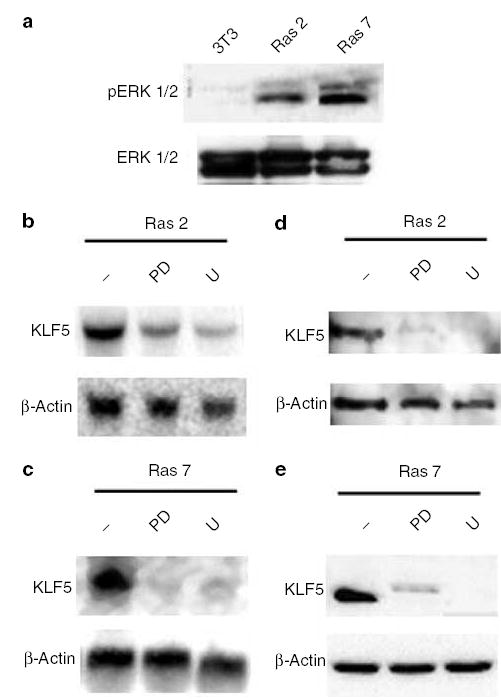
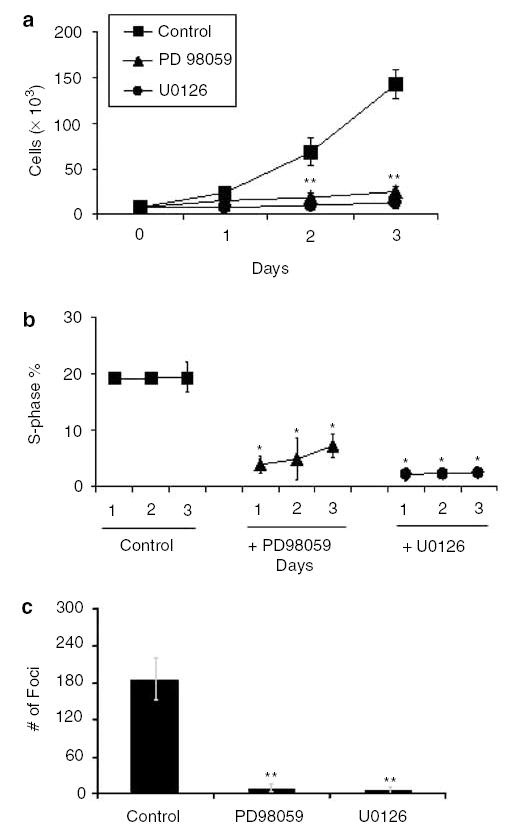
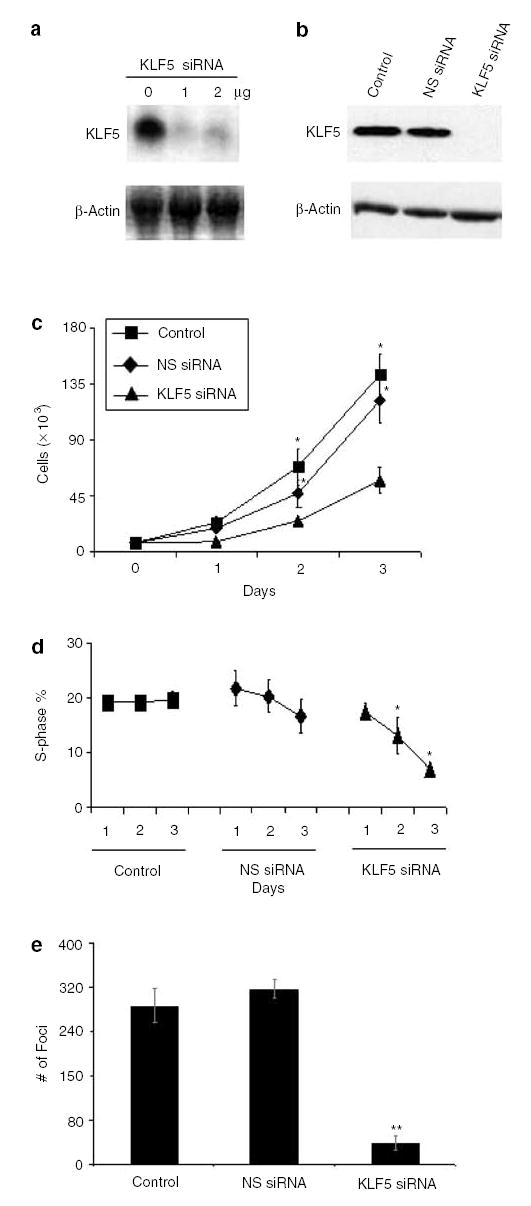
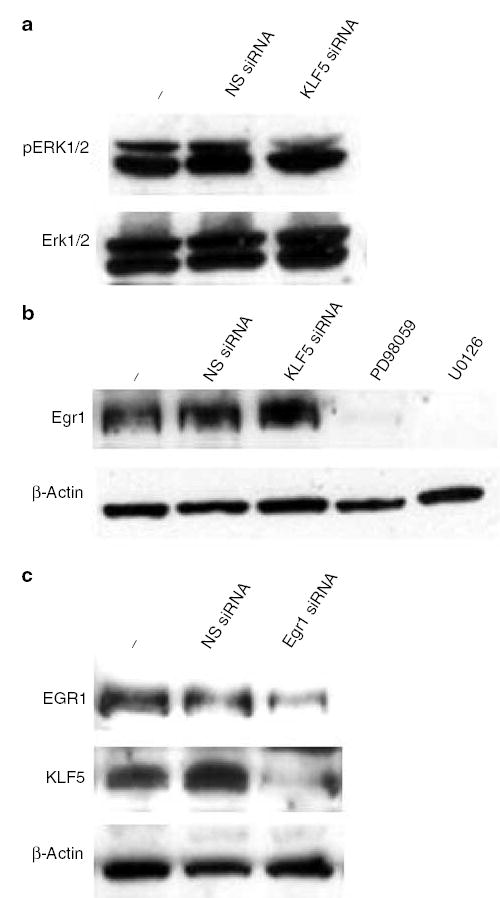
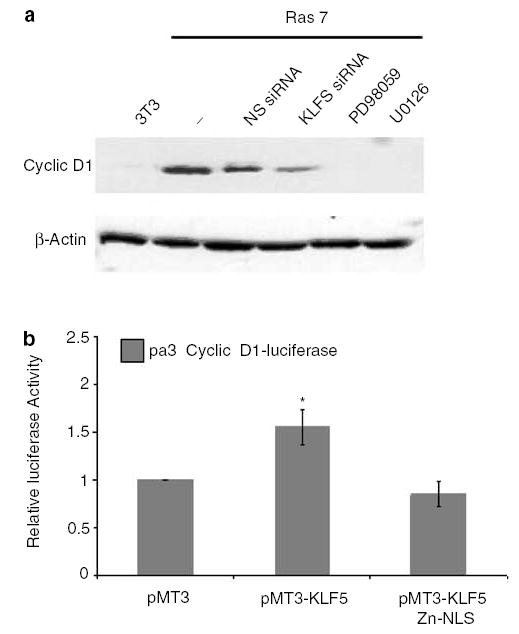
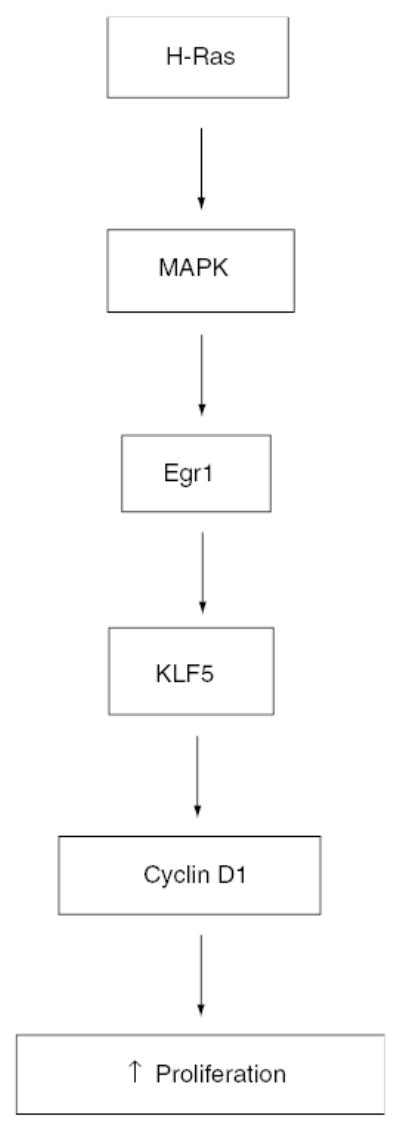
Previous studies indicate that Krüppel-like factor 5 (KLF5), also known as intestinal-enriched Krüppel-like factor (IKLF), is a positive regulator of cell proliferation and gives rise to a transformed phenotype when overexpressed. Here we demonstrate that levels of KLF5 transcript and protein are significantly elevated in oncogenic H-Ras-transformed NIH3T3 cells. These cells display an accelerated rate of proliferation in both serum-containing and serum-deprived media and form anchorage-independent colonies in soft agar assays. H-Ras-transformed cells also contain elevated mitogen-activated protein kinase (MAPK) activity. When treated with inhibitors of MEK (MAPK kinase), H-Ras-transformed cells lose their growth advantage and no longer form colonies. Significantly, levels of KLF5 transcript and protein are substantially reduced in H-Ras-transformed cells treated with MEK inhibitors. Moreover, inhibition of KLF5 expression in H-Ras-transformed cells with KLF5-specific small interfering RNA (siRNA) leads to a decreased rate of proliferation and a significant reduction in colony formation. H-Ras-transformed cells also contain elevated levels of Egr1 that are diminished by MEK inhibitors. Inhibition of Egr1 by siRNA results in a reduced level of KLF5, indicating that Egr1 mediates the inductive action of MAPK on KLF5. Lastly, KLF5 activates expression of cyclin D1. These findings indicate that the increased expression of KLF5 in H-Ras-transformed cells is secondary to increased MAPK activity from H-Ras overexpression and that the elevated level of KLF5 is in part responsible for the proproliferative and transforming activities of oncogenic H-Ras.


Figures

Figure 1
Figure 1
Effects of oncogenic H-Ras on cell proliferation in mouse fibroblasts. Panels a–d show results of experiments performed on control, untransformed NIH3T3 cells and two independently derived oncogenic H-Ras-transformed clones, designated as Ras 2 and Ras 7. In panels a and b, cells were seeded at 104 cells/well on day 0 and total cell numbers were counted every 24 h after seeding. Cells in panel a were supplemented with 10% FBS, while those in panel b were supplemented with 0.5% FBS. In panel c, cells were stained with PI and DNA content analysed by flow cytometry. The percentages of cells in the S-phase population were plotted over time. Panel d is the result of colony formation assay in soft agar in 10-cm dishes. N = 3 in all experiments. *P < 0.05; **P < 0.01 when compared with control NIH3T3 cells
Figure 2
Figure 2
Activation of KLF5 expression in NIH3T3 cells transformed by oncogenic H-Ras. Expression levels of H-Ras, KLF5 and β-actin were analysed in control NIH3T3 cells and the two H-Ras-transformed cells. Panel a shows the result of Northern blot analysis and panel b that of semiquantitative RT–PCR. Panel c is the result of quantitative (realTime) PCR on reverse-transcribed KLF5 and GAPDH cDNAs. The ratio denotes the relative level of expression of KLF5 after normalization with the GAPDH concentration. Panel d shows the results of Western blot analysis using antibodies specific to H-Ras, KLF5 and β-actin
Figure 3
Figure 3
Effect of MEK inhibition on KLF5 expression in H-Ras-transformed cells. Panel a shows the MAPK activity in NIH3T3, Ras 2 and Ras 7 cells as determined by the level of pERK1/2 (top row). The total amounts of ERK1/2 were determined by Western blot analysis using specific antibodies (bottom row). Panels b and c show the results of Northern blot analysis of RNA extracted from Ras 2 and Ras 7 cells, respectively, after treatment with two MEK inhibitors, PD98059 (PD) and U0126 (U). − indicates untreated cells. Panels d and e show the results of Western blot analysis of proteins extracted from Ras 2 and Ras 7 cells, respectively, after treatment with two MEK inhibitors, PD98059 (PD) and U0126 (U). − indicates untreated cells
Figure 4
Figure 4
Effect of MEK inhibition on the oncogenic H-Ras transformed phenotype. Panel a shows the total cell count in Ras 7 cells treated with MEK inhibitors, PD98059 and U0126. Cells were initially seeded at 5 × 10³ cells/well and supplemented with 10% FBS. Panel b shows the percentage of S-phase subpopulations of the cell cycle in cells treated with MEK inhibitors over a 3-day period. Panel c shows the result of soft agar assays, expressed as mean numbers of colonies per 10-cm dishes. Control represents untreated cells. N = 3 in all experiments. *P < 0.05; **P < 0.01 when compared with control Ras 7 cells
Figure 5
Figure 5
siRNA inhibition of KLF5 in H-Ras-transformed cells results in reduced proliferation. siRNA was used to inhibit KLF5 expression in Ras 7 cells. Panel a shows the result of Northern blot analysis of RNA isolated from Ras 7 cells treated with 0, 1, and 2 μg/10-cm dish of KLF5-specific siRNA. Panel b is the result of Western blot analysis of proteins from untreated control Ras 7 cells, and Ras 7 cells treated with 1 μg NS siRNA or KLF5-specific siRNA. Panel c shows the total cell count of untreated Ras 7 cells and Ras 7 cells treated with 1 μg of NS siRNA or KLF5-specific siRNA. Panel d shows the S-phase subpopulations of Ras 7 cells with different treatment conditions. Panel e is the result of colony formation in soft agar by Ras 7 cells with different treatment conditions. N = 3 in all experiments. *P < 0.05; **P < 0.01 when compared with control Ras 7 cells
Figure 6
Figure 6
The relationship among MAPK, Egr1 and KLF5 in the signaling pathway of oncogenic H-Ras. Panel a depicts the MAPK activity in Ras 7 cells treated with NS or KLF5-specific siRNA. pERK1/2 (top row) and ERK1/2 (bottom row) levels are shown. − indicates untreated cells. Panel b is the result of Western blot analysis for Egr1 in proteins extracted from Ras 7 cells that were untreated (−), or treated with NS siRNA, KLF5-specific siRNA, PD98059 or U0126. Panel c demonstrates the result of Western blot analysis of Egr1 and KLF5 in Ras 7 cells treated with NS or Egr1-specific siRNA. − indicated untreated cells
Figure 7
Figure 7
KLF5 regulates cyclin D1 expression. Panel a is a Western blot analysis of cyclin D1 in untransformed NIH3T3 cells or Ras 7 cells treated with the various conditions indicated in the figure. Panel b is the result of luciferase assays in NIH3T3 cells cotransfected with the cyclin D1 promoter-luciferase reporter and vector alone (PMT3), a construct containing full-length KLF5 (PMT3-KLF5) or truncated KLF5 (PMT3-KLF5 Zn-NLS). Relative luciferase activities after normalizing to an internal renilla luciferase are shown. N = 3. *P < 0.05 when compared to PMT3-transfected cells
Figure 8
Figure 8
A model of signaling pathway from oncogenic H-Ras to increased cell proliferation and transformation

References

    1. Barbacid M. Annu Rev Biochem. 1987;56:779–827. - PubMed
    1. Black AR, Black JD, Azizkhan-Clifford J. J Cell Physiol. 2001;188:143–160. - PubMed
    1. Bos JL, Fearon ER, Hamilton SR, Verlaan-de Vries M, van Boom JH, van der Eb AJ, Vogelstein B. Nature. 1987;327:293–297. - PubMed
    1. Chen C, Bhalala HV, Qiao H, Dong JT. Oncogene. 2002;21:6567–6572. - PubMed
    1. Chen C, Bhalala HV, Vessella RL, Dong JT. Prostate. 2003;55:81–88. - PubMed

Publication types

MeSH terms