. 2004 Jan;10(1):32-9.
doi: 10.3201/eid1001.020705.

Influenza epidemics in the United States, France, and Australia, 1972-1997

Affiliations

Influenza epidemics in the United States, France, and Australia, 1972-1997

Cécile Viboud et al. Emerg Infect Dis. 2004 Jan.

Abstract

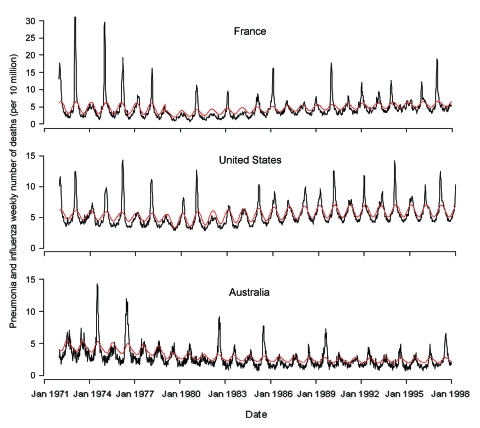
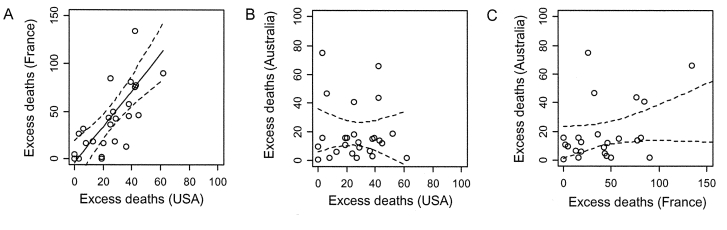
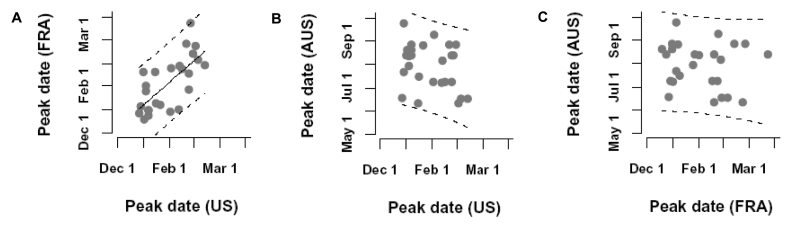
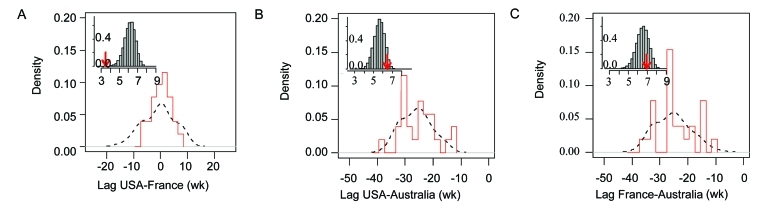
Influenza epidemics occur once a year during the winter in temperate areas. Little is known about the similarities between epidemics at different locations. We have analyzed pneumonia and influenza deaths from 1972 to 1997 in the United States, France, and Australia to examine the correlation over space and time between the three countries. We found a high correlation in both areas between France and the United States (correlation in impact, Spearman's r= 0.76, p < 0.001, and test for synchrony in timing of epidemics, p < 0.001). We did not find a similar correlation between the United States and Australia or between France and Australia, when considering a systematic half-year lead or delay of influenza epidemics in Australia as compared with those in the United States or France. These results support a high correlation at the hemisphere level and suggest that the global interhemispheric circulation of epidemics follows an irregular pathway with recurrent changes in the leading hemisphere.


Figures

Figure 1
Figure 1
Weekly number of influenza and pneumonia deaths per 100,000 population from January 1972 to December 1997 in the United States, France, and Australia (black line). The red line represents the epidemic threshold defined by a seasonal regression.
Figure 2
Figure 2
Correlation in the impact of influenza epidemics for 26 influenza years (1972–1997), measured by the annual number of pneumonia and influenza excess deaths. A, excess deaths per million in France (y axis) and the United States (x axis) in contemporaneous winters: Spearman correlation coefficient = 0.76 (p < 0.001). C, Excess deaths per million in Australia (y axis) and the United States (x axis), considering the scenario in which the influenza season in Australia is systematically 6 months before that of the United States: Spearman correlation coefficient = 0.14 (p = 0.50). C, excess deaths per million in Australia (y axis) and France (x axis), considering the scenario where the influenza season in Australia is systematically 6 months before that of France: Spearman correlation coefficient = 0.37 (p = 0.06). We obtained similar results as in B and C, when we considered a reverse scenario in which the influenza season in Australia was systematically lagging 6 months behind that in the United States or France.
Figure 3
Figure 3
Synchrony in the timing of the peaks of influenza epidemics for 26 influenza years (1972–1997). Correlation between the week of year of the epidemic peak A) in the United States (x axis) and in France (y axis). B, in the United States (x axis) and in Australia (y axis). C, in France (x axis) and in Australia (y axis). Panels b) and c) illustrate the scenario in which the influenza season in Australia is systematically 6 months before that of the United States or France. Similar results are obtained for the reverse scenario.
Figure 4
Figure 4
Synchrony in the timing of the peaks of influenza epidemics for 26 influenza years (1972–1997). Distribution of the time lags between the epidemic peaks in weeks (main plot). The red bars represent the observed lags, and the dashed line represents the distribution of lags obtained by permutations. (inset plot) Distribution of the standard deviation of permuted lags under the assumption of no synchrony. Red arrow indicates the standard deviation in the observed data. A, United States and France, b) United States and Australia, C, France and Australia. Panels B and C illustrate the scenario in which the influenza season in Australia is systematically 6 months before that of the United States or France. Similar results are obtained for the reverse scenario.

References

    1. Monto AS. Individual and community impact of influenza. Pharmacoeconomics. 1999;16:1–6. 10.2165/00019053-199916001-00001 - DOI - PubMed
    1. Cox NJ, Subbarao K. Influenza. Lancet. 1999;354:1277–82. 10.1016/S0140-6736(99)01241-6 - DOI - PubMed
    1. Simonsen L, Clarke MJ, Williamson GD, Stroup DF, Arden NH, Schonberger LB. The impact of influenza epidemics on mortality: introducing a severity index. Am J Public Health. 1997;87:1944–50. 10.2105/AJPH.87.12.1944 - DOI - PMC - PubMed
    1. Carrat F, Valleron AJ. Influenza mortality among the elderly in France, 1980–90: how many deaths may have been avoided through vaccination? J Epidemiol Community Health. 1995;49:419–25. 10.1136/jech.49.4.419 - DOI - PMC - PubMed
    1. Fleming DM, Zambon M, Bartelds AI, de Jong JC. The duration and magnitude of influenza epidemics: a study of surveillance data from sentinel general practices in England, Wales and the Netherlands. Eur J Epidemiol. 1999;15:467–73. 10.1023/A:1007525402861 - DOI - PubMed

Publication types

LinkOut - more resources