. 2004 May;14(5):908-16.
doi: 10.1101/gr.1837404. Epub 2004 Apr 12.

Haplotype block partitioning and tag SNP selection using genotype data and their applications to association studies

Affiliations

Haplotype block partitioning and tag SNP selection using genotype data and their applications to association studies

Kui Zhang et al. Genome Res. 2004 May.

Abstract

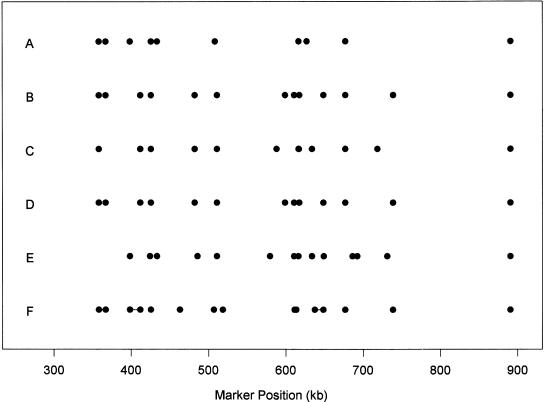
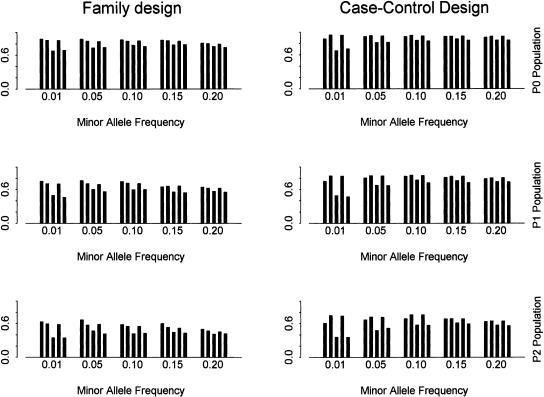
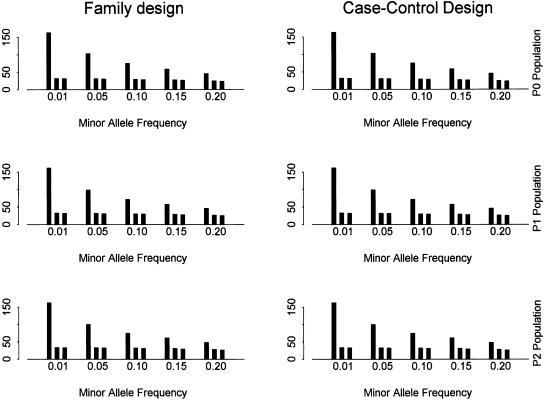
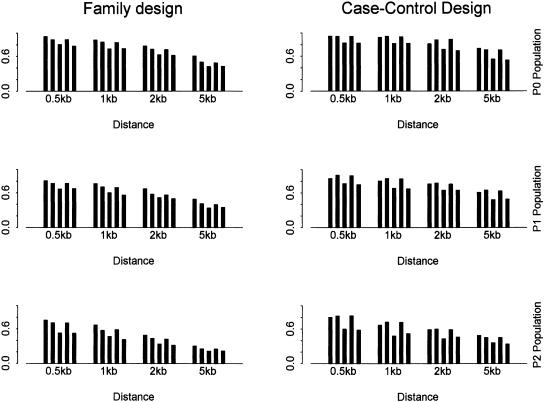
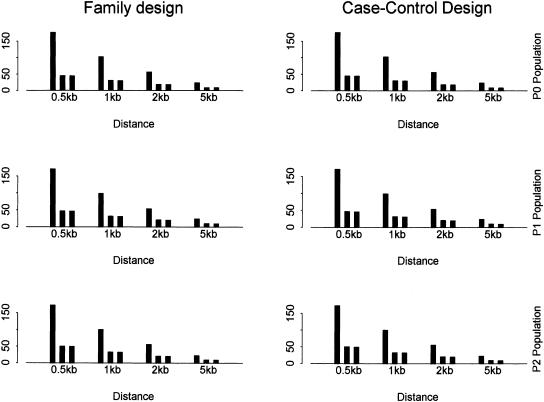
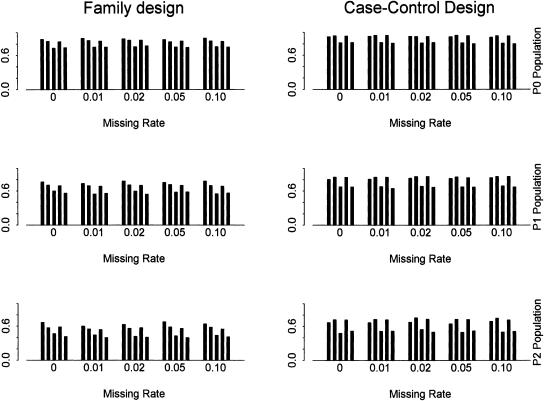
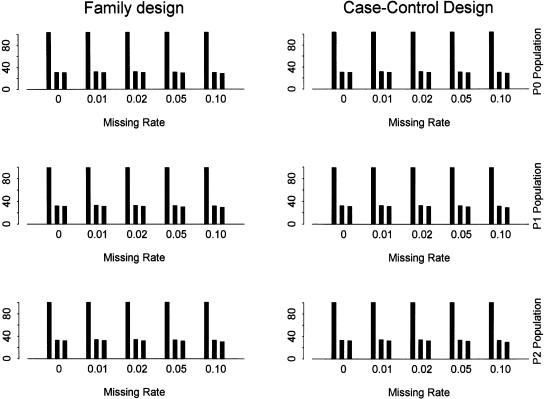
Recent studies have revealed that linkage disequilibrium (LD) patterns vary across the human genome with some regions of high LD interspersed by regions of low LD. A small fraction of SNPs (tag SNPs) is sufficient to capture most of the haplotype structure of the human genome. In this paper, we develop a method to partition haplotypes into blocks and to identify tag SNPs based on genotype data by combining a dynamic programming algorithm for haplotype block partitioning and tag SNP selection based on haplotype data with a variation of the expectation maximization (EM) algorithm for haplotype inference. We assess the effects of using either haplotype or genotype data in haplotype block identification and tag SNP selection as a function of several factors, including sample size, density or number of SNPs studied, allele frequencies, fraction of missing data, and genotyping error rate, using extensive simulations. We find that a modest number of haplotype or genotype samples will result in consistent block partitions and tag SNP selection. The power of association studies based on tag SNPs using genotype data is similar to that using haplotype data.


Figures

Figure 1
Figure 1
The positions of the ending SNPs in blocks. (AD) Genotype data are used. (A) α = 80%, β = 5%; (B) α = 80%, β = 10%; (C) α = 90%, β = 5%; (D) α = 90%, β = 10%; (E) α = 80%, β = 10% with the haplotype data. (F) The blocks reported in Daly et al. (2001), where lines indicate regions not in their blocks.
Figure 2
Figure 2
The power using SNPs with different minor allele frequencies with α = 80% and β = 10%. The SNP density is set as one SNP per kilobase. The power is obtained using two-locus haplotype data. In each bin (i.e., for each minor allele frequency), it shows the power using (from left to right): (1) all SNPs for block partitioning and tag SNP selection; (2) tag SNPs identified by the haplotype data; (3) the same number of random SNPs as in set 2; (4) tag SNPs identified by the genotype data; (5) the same number of random SNPs as in set 4.
Figure 3
Figure 3
The number of SNPs and tag SNPs for different minor allele frequencies with α = 80% and β = 10%. The SNP density is set as one SNP per kilobase. In each bin (i.e., for each minor allele frequency), it shows the number of (from left to right) (1) all SNPs for block partitioning and tag SNP selection; (2) tag SNPs identified by the haplotype data; (3) tag SNPs identified by the genotype data.
Figure 4
Figure 4
The power using SNPs with different density with α = 80% and β = 10%. SNPs with minor allele frequency >0.05 are used. The power is obtained using two-locus haplotype data. In each bin (i.e., distance between adjacent markers), it shows the power using (from left to right): (1) all SNPs for block partitioning and tag SNP selection; (2) tag SNPs identified by the haplotype data; (3) the same number of random SNPs as in set 2; (4) tag SNPs identified by the genotype data; (5) the same number of random SNPs as in set 4.
Figure 5
Figure 5
The number of SNPs and tag SNPs for different SNP density with α = 80% and β = 10%. SNPs with minor allele frequency >0.05 are used. In each bin (i.e., distance between adjacent markers), it shows the number of (from left to right) (1) all SNPs for block partitioning and tag SNP selection; (2) tag SNPs identified by the haplotype data; (3) tag SNPs identified by the genotype data.
Figure 6
Figure 6
The power for different missing rates with α = 80% and β = 10%. SNPs with minor allele frequency >0.05 are used. The SNP density is set as one SNP per kilobase. The power is obtained using two-locus haplotype data. In each bin (i.e., genotype missing rate), it shows the power using (from left to right): (1) all SNPs for block partitioning and tag SNP selection; (2) tag SNPs identified by the haplotype data; (3) the same number of random SNPs as in set 2; (4) tag SNPs identified by the genotype data; (5) the same number of random SNPs as in set 4.
Figure 7
Figure 7
The number of SNPs and tag SNPs for different genotype missing rates with α = 80% and β = 10%. The SNPs with minor allele frequency >0.05 are used. The SNP density is set as one SNP per kilobase. In each bin (i.e., genotype missing rate), it shows the number of (from left to right) (1) all SNPs for block partitioning and tag SNP selection; (2) tag SNPs identified by the haplotype data; (3) tag SNPs identified by the genotype data.

Similar articles

Cited by

References

    1. Abecasis, G.R. and Cookson, W.O. 2000. GOLD—Graphical overview of linkage disequilibrium. Bioinformatics 16: 182-183. - PubMed
    1. Anderson, E.C. and Novembre, J. 2003. Finding haplotype block boundaries by using the minimum-description-length principle. Am. J. Hum. Genet. 73: 336-354. - PMC - PubMed
    1. Cardon, L.R., Ke, X., Lawrence, R., Carter, N., Rogers, J., Stavrides, G., Willey, D., Mullikin, J., Hunt, S., Bentley, D.R., et al. 2003. Towards a fine-scale linkage disequilibrium map of human chromosome 20. Am. J. Hum. Genet. 73 (Suppl): 271. - PubMed
    1. Clark, A.G. 1990. Inference of haplotypes from PCR-amplified samples of diploid populations. Mol. Biol. Evol. 7: 111-122. - PubMed
    1. Daly, M.J., Rioux, J.D., Schaffner, S.F., Hudson, T.J., and Lander, E.S. 2001. High-resolution haplotype structure in the human genome. Nat. Genet. 29: 229-232. - PubMed

Publication types

MeSH terms