. 2004 Apr 27;101(17):6752-7.
doi: 10.1073/pnas.0308636100. Epub 2004 Apr 13.

Extracellular acidosis increases neuronal cell calcium by activating acid-sensing ion channel 1a

Affiliations

Extracellular acidosis increases neuronal cell calcium by activating acid-sensing ion channel 1a

Olena Yermolaieva et al. Proc Natl Acad Sci U S A. .

Abstract

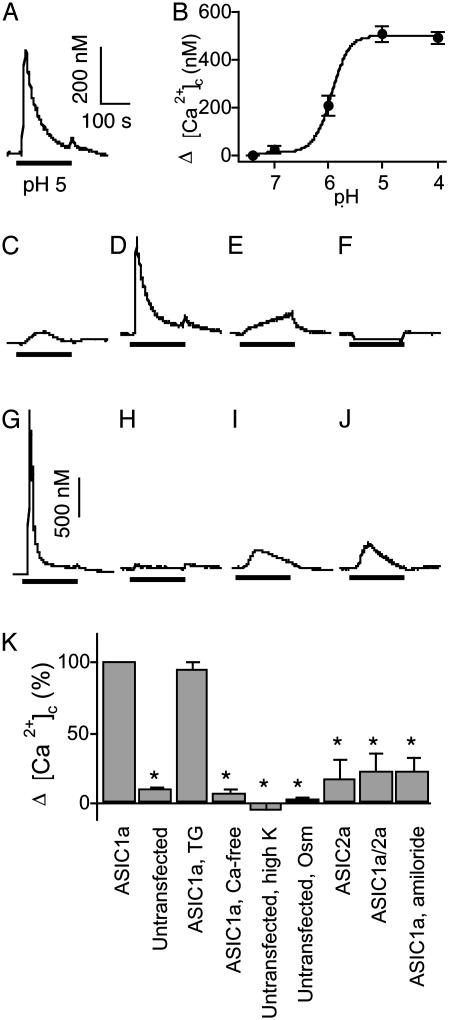
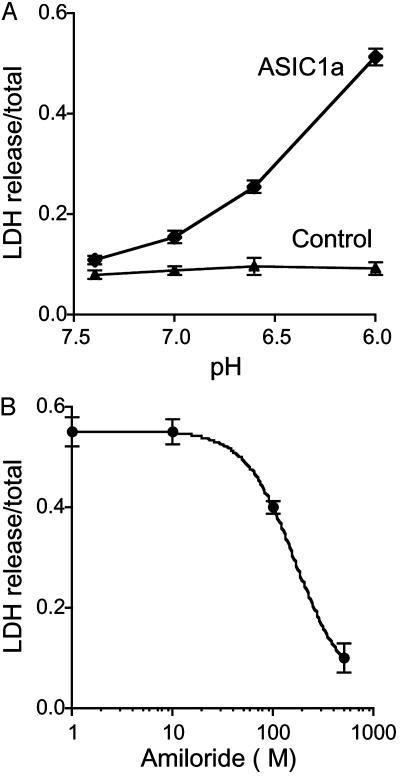
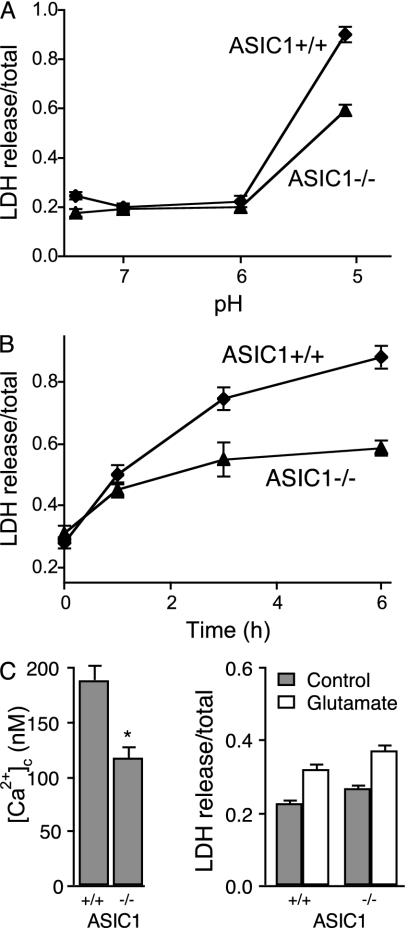
Acid-sensing ion channel (ASIC) 1a subunit is expressed in synapses of central neurons where it contributes to synaptic plasticity. However, whether these channels can conduct Ca(2+) and thereby raise the cytosolic Ca(2+) concentration, [Ca(2+)](c), and possibly alter neuronal physiology has been uncertain. We found that extracellular acidosis opened ASIC1a channels, which provided a pathway for Ca(2+) entry and elevated [Ca(2+)](c) in wild-type, but not ASIC1(-/-), hippocampal neurons. Acid application also raised [Ca(2+)](c) and evoked Ca(2+) currents in heterologous cells expressing ASIC1a. Although ASIC2a is also expressed in central neurons, neither ASIC2a homomultimeric channels nor ASIC1a/2a heteromultimers showed H(+)-activated [Ca(2+)](c) elevation or Ca(2+) currents. Because extracellular acidosis accompanying cerebral ischemia contributes to neuronal injury, we tested the effect of acidosis on cell death measured as lactate dehydrogenase release. Eliminating ASIC1a from neurons or treating ASIC1a-expressing cells with the ASIC blocker amiloride attenuated acidosis-induced cell injury. These results indicate that ASIC1a provides a non-voltage-gated pathway for Ca(2+) to enter neurons. Thus, it may provide a target for modulation of [Ca(2+)](c).


Figures

Fig. 1.
Fig. 1.
ASIC-mediated changes in [Ca2+]c in COS-7 cells. (A) [Ca2+]c elevation generated by a pH 5 stimulus (indicated by bar) in cells expressing ASIC1a. The pH of the control solution was 7.4. (Scale bars show change in [Ca2+]c for all panels except G, in which bar represents 1 μM.) (B) Relationship between the pH of the stimulus and the maximal [Ca2+]c increase in ASIC1a-transfected cells (n = 4). (C) Response of untransfected cells to a pH 5 stimulus. (D) Response to pH 5 stimulus in ASIC1a-transfected cells pretreated with 1 μM thapsigargin (TG). (E) Response to pH 5 in ASIC1a-transfected cells in nominally Ca2+-free medium. (F) Response to application of medium containing a high K+ concentration (35 mM) in untransfected cells, pH 7.4. (G) Response to pH 5 in Na+-free medium in ASIC1a-transfected cells. The increase in [Ca2+]c was 1.39 ± 0.37 μM (n = 6). (H) Response to 10% reduced osmolarity (pH 7.4) medium in untransfected cells. (I) Response to pH 5 stimulus in ASIC2atransfected cells. (J) Response to pH 5 stimulus in cells transfected with ASIC1a plus ASIC2a. (K) Average data from experiments shown in A, C-F, and H-J. Change in [Ca2+]c of ASIC1a-expressing cells is indicated as 100%. Data are mean ± SEM; n = 6-8. *, P < 0.05 compared with ASIC1a-transfected cells.
Fig. 2.
Fig. 2.
Acid-evoked currents in Chinese hamster ovary cells expressing ASIC subunits. Cells were superfused with Na+-free solution containing 2 mM Ca2+ (Left) or Ca2+-free solution (Right); both panels are from the same cell. The pH was reduced from 7.4 to 4.5 during times indicated by bars. (A) Untransfected cells. Maximal H+-activated current was -24 ± 6 pA in the presence of Ca2+ and -13 ± 5 pA in the absence of Ca2+ (n = 6). (B) Cells expressing ASIC1a. Maximal H+-activated current was -1432 ± 297 pA in the presence of Ca2+ and -43 ± 24 pA in the absence of Ca2+ (n = 6). (C) Cells expressing ASIC2a. Maximal H+-activated current was -24 ± 12 pA in the presence of Ca2+ and -35 ± 14 pA in the absence of Ca2+ (n = 5). (D) Cells expressing ASIC1a/2a. Maximal H+-activated current was -80 ± 71 pA in the presence of Ca2+ and -76 ± 35 pA in the absence of Ca2+ (n = 5).
Fig. 3.
Fig. 3.
[Ca2+]c response to a pH 6 stimulus in cultured mouse hippocampal neurons. (A) Representative traces from wild-type and ASIC1-/- neurons. Control solution was pH 7.4, and pH 6 application is indicated by bar. Average frequency and amplitude of the oscillations before pH 6 application were 4.1 ± 2.8 oscillations/min and 276 ± 64 nM Ca2+ for wild-type, and 4.4 ± 2.3 oscillations/min and 316 ± 71 nM Ca2+ for ASIC1-/-. These values were not statistically different. pH 6 eliminated oscillations in neurons of both genotypes but increased [Ca2+]c in ASIC1+/+ neurons only. (B) Basal [Ca2+]c in wild-type and ASIC1 null neurons. (C) Maximal change in [Ca2+]c induced by pH 6. (D) [Ca2+]c after 4 min of continuous superfusion of pH 6 solution. Data are mean ± SEM, n = 8. *, P < 0.05.
Fig. 4.
Fig. 4.
Acidosis-induced LDH release from COS-7 cells expressing ASIC1a. (A) Effect of pH on LDH release from cells expressing ASIC1a or control cells (expressing GFP). Cells were exposed to solution of the indicated pH for 6 h, and LDH release was assessed 24 h later. (B) Effect of amiloride on LDH release from ASIC1a-transfected cells exposed to pH 6 solutions (n = 3).
Fig. 5.
Fig. 5.
LDH release from hippocampal neurons. (A) Effect of pH on LDH release from wild-type and ASIC1a null neurons. Solutions were applied for 6 h, and LDH release measured 24 h later (n = 3). (B) Effect of duration of acid (pH 5) application on LDH release (n = 3). (C) [Ca2+]c in wild-type and ASIC1-/- neurons measured 24 h after exposure to a pH 6 solution for 6 h (n = 6). (D) Glutamate-induced LDH release in wild-type and ASIC1-/- neurons. Glutamate (100 μM) was applied for 30 min, and LDH release was measured 24 h later (n = 3). Gray bars indicate control (no treatment), and open bars indicate glutamate treatment.

Similar articles

Cited by

References

    1. Krishtal, O. (2003) Trends Neurosci. 26, 477-483. - PubMed
    1. Waldmann, R., Champigny, G., Bassilana, F., Heurteaux, C. & Lazdunski, M. (1997) Nature 386, 173-177. - PubMed
    1. García-Añoveros, J., Derfler, B., Neville-Golden, J., Hyman, B. T. & Corey, D. P. (1997) Proc. Natl. Acad. Sci. USA 94, 1459-1464. - PMC - PubMed
    1. Wemmie, J. A., Askwith, C. C., Lamani, E., Cassell, M. D., Freeman, J. H. J. & Welsh, M. J. (2003) J. Neurosci. 23, 5496-5502. - PMC - PubMed
    1. Alvarez de la Rosa, D., Krueger, S. R., Kolar, A., Shao, D., Fitzsimonds, R. M. & Canessa, C. M. (2003) J. Physiol. 546, 77-87. - PMC - PubMed

Publication types

LinkOut - more resources