Dual FRET molecular beacons for mRNA detection in living cells
- PMID: 15084672
- PMCID: PMC390379
- DOI: 10.1093/nar/gnh062
Dual FRET molecular beacons for mRNA detection in living cells
Abstract
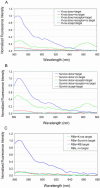
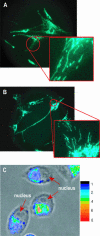
The ability to visualize in real-time the expression level and localization of specific endogenous RNAs in living cells can offer tremendous opportunities for biological and disease studies. Here we demonstrate such a capability using a pair of molecular beacons, one with a donor and the other with an acceptor fluorophore that hybridize to adjacent regions on the same mRNA target, resulting in fluorescence resonance energy transfer (FRET). Detection of the FRET signal significantly reduced false positives, leading to sensitive imaging of K-ras and survivin mRNAs in live HDF and MIAPaCa-2 cells. FRET detection gave a ratio of 2.25 of K-ras mRNA expression in stimulated and unstimulated HDF, comparable to the ratio of 1.95 using RT-PCR, and in contrast to the single-beacon result of 1.2. We further revealed intriguing details of K-ras and survivin mRNA localization in living cells. The dual FRET molecular beacons approach provides a novel technique for sensitive RNA detection and quantification in living cells.
Figures


Similar articles
-
Peptide-linked molecular beacons for efficient delivery and rapid mRNA detection in living cells.Nucleic Acids Res. 2004 Apr 14;32(6):e58. doi: 10.1093/nar/gnh063. Nucleic Acids Res. 2004. PMID: 15084673 Free PMC article.
-
Molecular beacon imaging of tumor marker gene expression in pancreatic cancer cells.Cancer Biol Ther. 2005 May;4(5):561-70. doi: 10.4161/cbt.4.5.1670. Epub 2005 May 20. Cancer Biol Ther. 2005. PMID: 15917666 Free PMC article.
-
Nanostructured probes for RNA detection in living cells.Ann Biomed Eng. 2006 Jan;34(1):39-50. doi: 10.1007/s10439-005-9003-6. Epub 2006 Feb 7. Ann Biomed Eng. 2006. PMID: 16463087 Review.
-
Specific survivin dual fluorescence resonance energy transfer molecular beacons for detection of human bladder cancer cells.Acta Pharmacol Sin. 2011 Dec;32(12):1522-8. doi: 10.1038/aps.2011.122. Epub 2011 Oct 24. Acta Pharmacol Sin. 2011. PMID: 22019956 Free PMC article.
-
Detecting RNA/DNA hybridization using double-labeled donor probes with enhanced fluorescence resonance energy transfer signals.Methods Mol Biol. 2006;335:43-56. doi: 10.1385/1-59745-069-3:43. Methods Mol Biol. 2006. PMID: 16785619 Review.
Cited by
-
Molecular beacons can assess changes in expression and 3'-polyadenylation of human eNOS mRNA.Am J Physiol Cell Physiol. 2009 Mar;296(3):C498-504. doi: 10.1152/ajpcell.00462.2008. Epub 2008 Dec 24. Am J Physiol Cell Physiol. 2009. PMID: 19109525 Free PMC article.
-
DNA-Dye-Conjugates: Conformations and Spectra of Fluorescence Probes.PLoS One. 2016 Jul 28;11(7):e0160229. doi: 10.1371/journal.pone.0160229. eCollection 2016. PLoS One. 2016. PMID: 27467071 Free PMC article.
-
ON-OFF switching of transcriptional activity of large DNA through a conformational transition in cooperation with phospholipid membrane.J Am Chem Soc. 2010 Sep 8;132(35):12464-71. doi: 10.1021/ja105154k. J Am Chem Soc. 2010. PMID: 20704293 Free PMC article.
-
An Exonuclease I-Based Quencher-Free Fluorescent Method Using DNA Hairpin Probes for Rapid Detection of MicroRNA.Sensors (Basel). 2017 Apr 3;17(4):760. doi: 10.3390/s17040760. Sensors (Basel). 2017. PMID: 28368358 Free PMC article.
-
Fluorescence Resonance Energy Transfer-Based DNA Tetrahedron Nanotweezer for Highly Reliable Detection of Tumor-Related mRNA in Living Cells.ACS Nano. 2017 Apr 25;11(4):4060-4066. doi: 10.1021/acsnano.7b00725. Epub 2017 Mar 30. ACS Nano. 2017. PMID: 28328200 Free PMC article.
References
-
- Tsien R.Y. (2003) Imagining imaging’s future. Nat. Rev. Mol. Cell Biol., 4, ss16–21. - PubMed
-
- Femino A.M., Fay,F.S., Fogarty,K. and Singer,R.H. (1998) Visualization of single RNA transcripts in situ. Science, 280, 585–590. - PubMed
-
- Tyagi S. and Kramer,F.R. (1996) Molecular beacons: probes that fluoresce upon hybridization. Nat. Biotechnol., 14, 303–308. - PubMed
-
- Tyagi S., Bratu,S.P. and Kramer,F.R. (1998) Multicolor molecular beacons for allele discrimination. Nat. Biotechnol., 16, 49–53. - PubMed
Publication types
MeSH terms
Substances
LinkOut - more resources
Full Text Sources
Other Literature Sources
Miscellaneous

