. 2004 May;16(5):1143-62.
doi: 10.1105/tpc.021584. Epub 2004 Apr 14.

The ascorbic acid redox state controls guard cell signaling and stomatal movement

Affiliations

The ascorbic acid redox state controls guard cell signaling and stomatal movement

Zhong Chen et al. Plant Cell. 2004 May.

Abstract

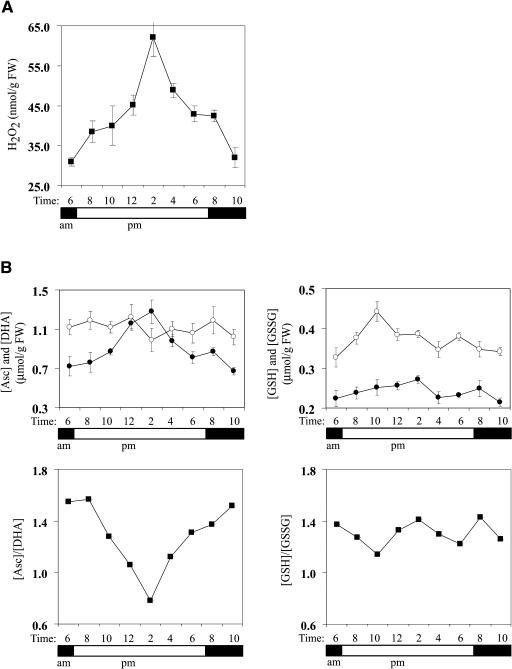
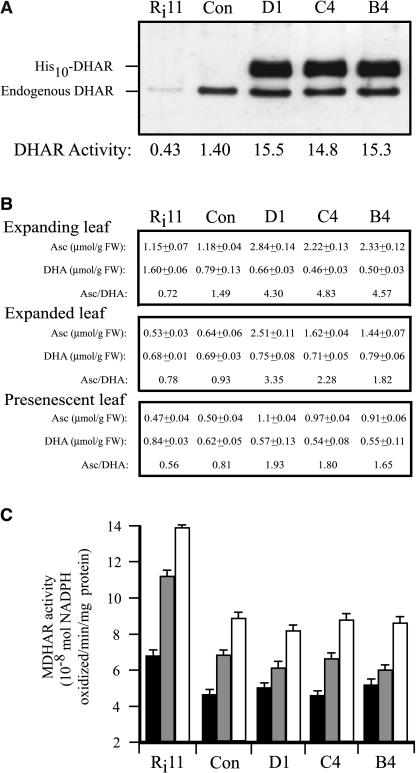
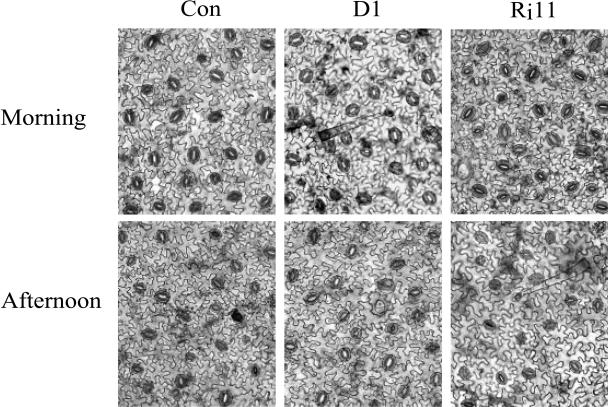
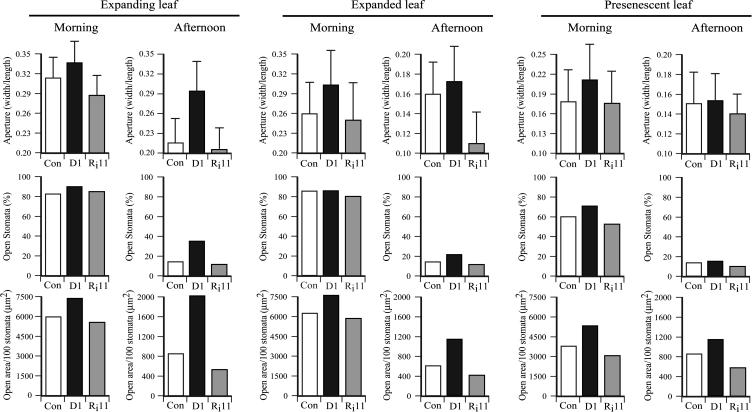
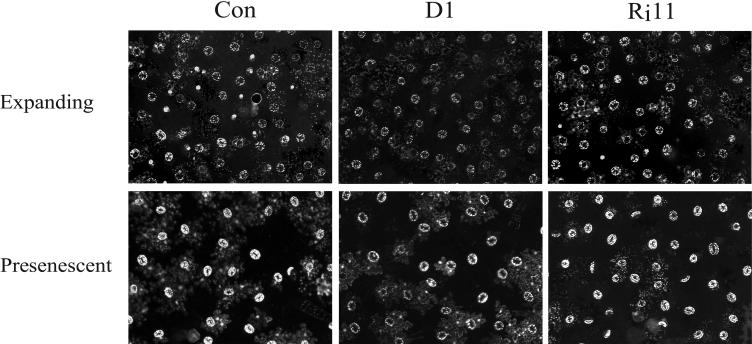
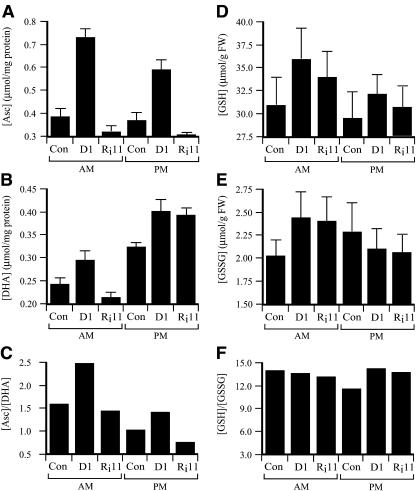
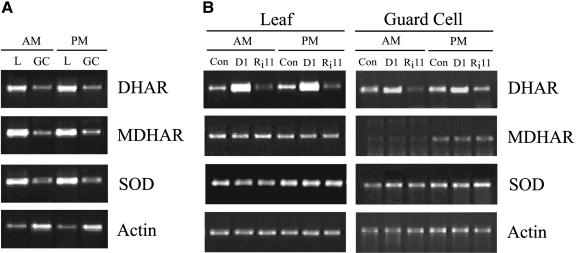
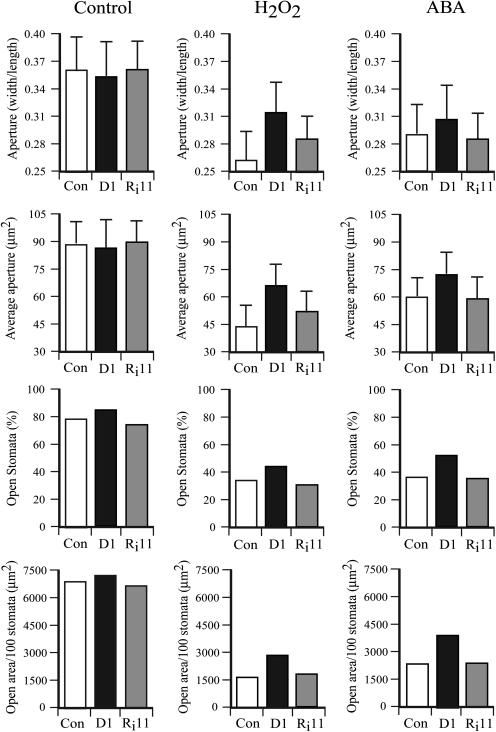
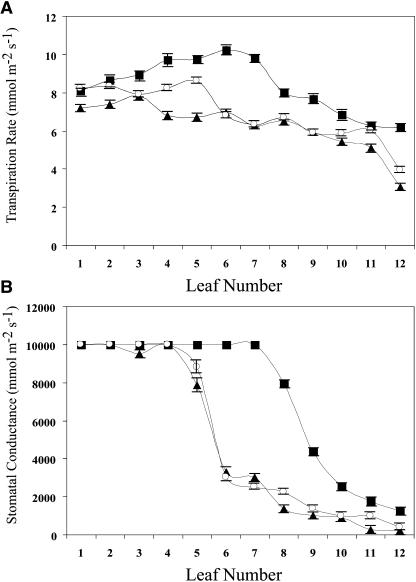
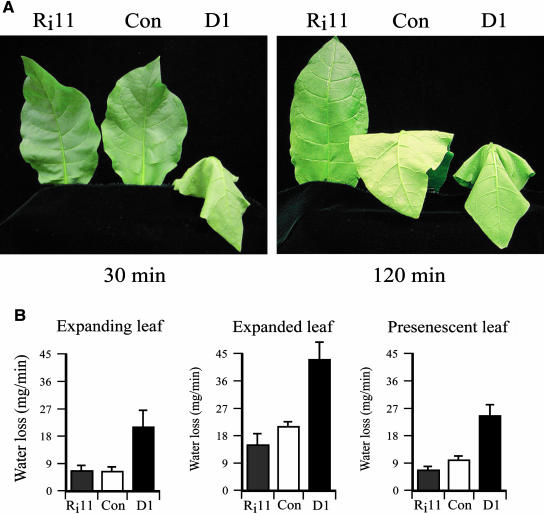
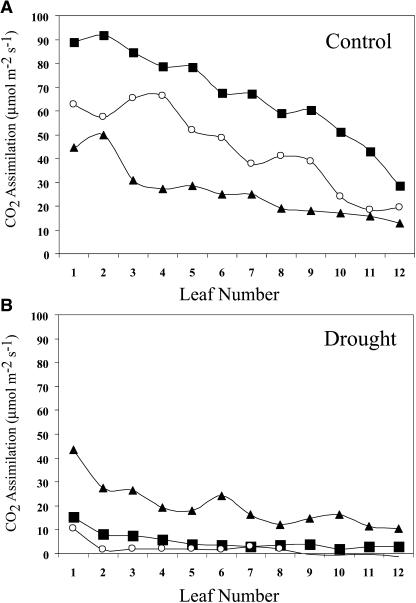
H(2)O(2) serves an important stress signaling function and promotes stomatal closure, whereas ascorbic acid (Asc) is the major antioxidant that scavenges H(2)O(2). Dehydroascorbate reductase (DHAR) catalyzes the reduction of dehydroascorbate (oxidized ascorbate) to Asc and thus contributes to the regulation of the Asc redox state. In this study, we observed that the level of H(2)O(2) and the Asc redox state in guard cells and whole leaves are diurnally regulated such that the former increases during the afternoon, whereas the latter decreases. Plants with an increased guard cell Asc redox state were generated by increasing DHAR expression, and these exhibited a reduction in the level of guard cell H(2)O(2). In addition, a higher percentage of open stomata, an increase in total open stomatal area, increased stomatal conductance, and increased transpiration were observed. Guard cells with an increase in Asc redox state were less responsive to H(2)O(2) or abscisic acid signaling, and the plants exhibited greater water loss under drought conditions, whereas suppressing DHAR expression conferred increased drought tolerance. Our analyses suggest that DHAR serves to maintain a basal level of Asc recycling in guard cells that is insufficient to scavenge the high rate of H(2)O(2) produced in the afternoon, thus resulting in stomatal closure.


Figures

Figure 1.
Figure 1.
Diurnal Regulation of H2O2, Asc, DHA, GSH, and GSSG. Leaf samples were taken at 2-h intervals from 6 am to 10 pm and assayed for H2O2 (A), Asc (B), GSH (open circles), and DHA and GSSG (closed circles). Each was assayed in three independent replicates of leaves pooled from three independent plants, and the average and standard deviation were reported. The Asc and GSH redox state was determined from the Asc/DHA and GSH/GSSG ratios. The bar below each graph indicates dark and light periods.
Figure 2.
Figure 2.
Diurnal Regulation of DHAR, GR, CAT, APX, and SOD Activities. Leaf samples were taken at 2-h intervals from 6 am to 10 pm and assayed for DHAR, MDHAR, GR, CAT, APX, and SOD. Enzyme activities were assayed in three independent replicates of leaves pooled from three independent plants, and the average and standard deviation were reported. The bar below each graph indicates dark and light periods.
Figure 3.
Figure 3.
Generation of DHAR-Overexpressing and DHAR-Suppressed Tobacco. (A) Protein gel blot analysis of DHAR in tobacco suppressed for endogenous DHAR (Ri11), vector-only control (Con), and overexpressing wheat DHAR (D1, C4, and B4). The positions of the His-tag wheat DHAR (His10-DHAR) and endogenous tobacco DHAR are indicated. DHAR activity measured in each leaf type is represented below each lane. (B) The amount of Asc and DHA was measured in expanding leaves, expanded leaves (which exhibited maximal photosynthetic activity), and presenescent leaves of DHAR-suppressed, control, and DHAR-overexpressing transgenic lines. Measurements were made in the afternoon from three independent replicates of leaves pooled from three independent plants, and the average and standard deviation were reported. The Asc redox state is indicated as the Asc/DHA ratio. FW, fresh weight. (C) MDHAR activity (10−8 mol NAPDH oxidized/min/mg protein) was measured in expanding leaves (black histograms), expanded leaves (gray histograms), and presenescent leaves (white histograms) of DHAR-suppressed (Ri11), control (Con), and DHAR-overexpressing (D1) plants. The enzyme activity was assayed in three independent replicates of leaves pooled from three independent plants, and the average and standard deviation were reported.
Figure 4.
Figure 4.
Stomata in Tobacco with Altered Asc Redox State. Abaxial epidermis was collected in the morning and afternoon from expanding leaves of control (Con), DHAR-overexpressing (D1), and DHAR-suppressed (Ri11) tobacco and stained with 0.2% toluidine blue O before imaging using a compound microscope. A representative region from each line is presented.
Figure 5.
Figure 5.
The Asc Redox State Controls Stomatal Movement. Stomatal bioassay experiments were performed as described (Pei et al., 1997). Abaxial epidermis was collected from expanding, expanded, and presenescent leaves of control (Con), DHAR-overexpressing (D1), and DHAR-suppressed (Ri11) tobacco leaves. Epidermal strips were stained and imaged as described in Figure 2. The width and length of at least 30 stomatal apertures were measured and used to determine the stomatal aperture (width/length) with the standard deviation indicated. The percentage of stomata that were open (defined as having a width >1 μm) was determined from at least 400 stomata. The total stomatal open area was calculated from the average stomatal aperture area and percentage of stomata that were open and reported as the total area (μm2) per 100 stomata.
Figure 6.
Figure 6.
The Asc Redox State Controls H2O2 Concentration in Guard Cells. Abaxial epidermis was collected in the morning from control (Con), DHAR-overexpressing (D1), and DHAR-suppressed (Ri11) tobacco leaves. H2O2 production was revealed after loading with H2DCF-DA. Fluorescence (excitation 465 to 495 nm, emission 510 to 530 nm) was recorded using confocal microscopy. A representative region from each line is presented.
Figure 7.
Figure 7.
Alteration of the Asc Redox State in Guard Cells. The level of Asc (A), DHA (B), GSH (D), and GSSG (E) was measured from guard cells isolated from control (Con), DHAR-overexpressing (D1), and DHAR-suppressed (Ri11) tobacco leaves collected in the morning (am) and afternoon (pm). The Asc redox state (C) determined by [Asc]/[DHA] and the GSH redox state (F) determined by [GSH]/[GSSG] also were determined. FW, fresh weight.
Figure 8.
Figure 8.
Alteration of the Apoplastic Asc Redox State. The level of Asc (A) and DHA (B) was measured from apoplastic fluid from control (Con), DHAR-overexpressing (D1), and DHAR-suppressed (Ri11) tobacco leaves collected in the morning (am) and afternoon (pm). The Asc redox state (C) determined by [Asc]/[DHA] also was determined. FW, fresh weight. Ascorbate oxidase (AOX) was also measured (D).
Figure 9.
Figure 9.
Expression Analysis of DHAR in Guard Cells and Leaves. (A) Total RNA was isolated from leaves (L) and guard cell (GC) protoplasts isolated from control tobacco leaves collected in the morning (am) and afternoon (pm). The relative abundance of transcript amounts for DHAR, MDHAR, SOD, and actin were determined using RT-PCR. The number of cycles of amplification required to detect a transcript while maintaining its amplification in the linear range was 28 for DHAR, 35 for MDHAR, 32 for SOD, and 32 for actin for both whole leaves and isolated guard cells. (B) Total RNA was isolated from leaves and guard cell protoplasts isolated from control (Con), DHAR-overexpressing (D1), and DHAR-suppressed (Ri11) tobacco leaves collected in the morning (am) and afternoon (pm). The number of cycles of amplification required to detect a transcript while maintaining its amplification in the linear range was 28 and 32 for DHAR, 30 and 35 for MDHAR, 28 and 32 for SOD, and 32 and 28 for actin for whole leaves and isolated guard cells, respectively.
Figure 10.
Figure 10.
The Asc Redox State Controls Guard Cell Responsiveness to H2O2 and ABA Signaling. Abaxial epidermis was collected in the morning from expanded leaves of control (Con), DHAR-overexpressing (D1), and DHAR-suppressed (Ri11) tobacco leaves. After incubation in CO2-free buffer under a photon flux density of 200 μmol−2 s−1 to promote stomatal opening, stomatal closure was induced by 50 μM ABA or 1 mM H2O2. Epidermal strips were stained with toluidine blue O or loaded with fluorescence dye to determine the production of H2O2. The width and length of at least 70 stomatal apertures were measured and used to determine aperture area with the standard deviation indicated. The percentage of stomata that were open was determined from at least 400 stomata. The total stomatal open area was calculated by multiplying the area of the average stomatal aperture by the percentage of stomata that were open and reported as the total area (μm2) per 100 stomata.
Figure 11.
Figure 11.
The Asc Redox State Controls Transpiration and Stomatal Conductance. In situ rates of transpiration (A) and stomatal (B) conductance were measured in the afternoon from control (open circles), DHAR-overexpressing (closed circles), and DHAR-suppressed (closed triangles) tobacco leaves using a TPS-1 portable photosynthesis system. Transpiration and stomatal conductance were assayed in every other leaf in three independent replicates of leaves pooled from three independent plants, and the average and standard deviation were reported.
Figure 12.
Figure 12.
The Asc Redox State Controls Water Loss from Tobacco Leaves. Expanded leaves were detached from well-watered plants in the afternoon and immediately weighed. (A) Images of representative expanded leaves were taken at 30 and 120 min after their detachment. (B) Water loss from the detached leaves held at room temperature was followed by determining leaf weight every 5 min for 40 min. Four leaves from separate plants were used. The rate of water loss as loss in leaf weight was plotted against time, and the average and standard deviation were reported.
Figure 13.
Figure 13.
The Asc Redox State Controls Drought Tolerance. CO2 assimilation was measured in every other leaf from control (open circles), DHAR-overexpressing (closed squares), and DHAR-suppressed (closed triangles) tobacco leaves (A) under well-watered conditions and after the imposition of a severe drought (B). CO2 assimilation was measured using a TPS-1 portable photosynthesis system. Drought stress was evident in control and DHAR-overexpressing plants by their leaf wilting.

References

    1. Aebi, H. (1984). Catalase in vitro. Methods Enzymol. 105, 121–126. - PubMed
    1. Asada, K. (1999). The water-water cycle in chloroplasts: Scavenging of active oxygens and dissipation of excess photons. Annu. Rev. Plant Physiol. Plant Mol. Biol. 50, 601–639. - PubMed
    1. Assmann, S.M. (1993). Signal transduction in guard cells. Annu. Rev. Cell Biol. 9, 345–375. - PubMed
    1. Assmann, S.M., and Wang, X.Q. (2001). From milliseconds to millions of years: Guard cells and environmental responses. Curr. Opin. Plant Biol. 4, 421–428. - PubMed
    1. Blatt, M.R. (2000). Cellular signaling and volume control in stomatal movements in plants. Annu. Rev. Cell Dev. Biol. 16, 221–241. - PubMed

Publication types

Associated data