

Review
doi: 10.1172/JCI21560.
Salt handling and hypertension
Affiliations
- PMID: 15085183
- PMCID: PMC385413
- DOI: 10.1172/JCI21560
Item in Clipboard
Review
Salt handling and hypertension
J Clin Invest.
2004 Apr.
Abstract
The kidney plays a central role in our ability to maintain appropriate sodium balance, which is critical to determination of blood pressure. In this review we outline current knowledge of renal salt handling at the molecular level, and, given that Westernized societies consume more salt than is required for normal physiology, we examine evidence that the lowering of salt intake can combat hypertension.
Figures
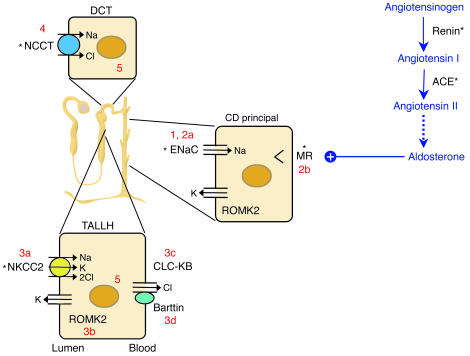
The renin-angiotensin-aldosterone axis and molecular pathways of sodium reabsorption in the nephron. A cartoon of a nephron is shown, with sodium-reabsorbing cells of the thick ascending limb of the loop of Henle (TALLH), distal convoluted tubule (DCT), and collecting duct (CD). The latter is responsible for fine regulation via the aldosterone-activated mineralocorticoid receptor (MR). In all cells, sodium exits the basolateral compartment via the Na/K-ATPase (not shown). Aldosterone synthesis is controlled by angiotensin II. Numbers reflect cellular components affected in disorders of sodium homeostasis referred to in the text: 1, Liddle syndrome; 2a/b, recessive/dominant PHA1; 3a/b/c/d, types I/II/III/IV Bartter syndrome; 4, Gitelman syndrome; 5, Gordon syndrome. *Sites of action of antihypertensive drugs. ROMK2, renal outer medullary potassium channel.
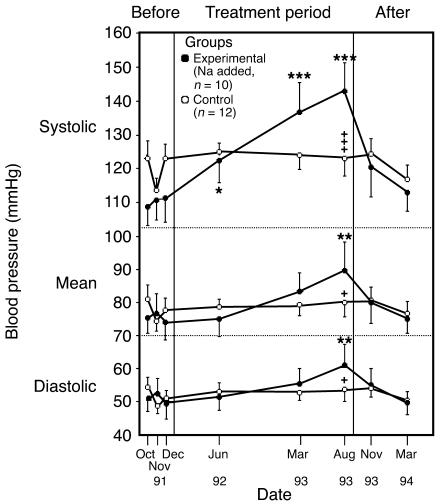
BP changes in chimpanzees fed a salt-supplemented diet. Twenty-two chimpanzees were fed infant formula either alone (n = 12) or with added salt (n = 10) as follows: 5 g/d for 19 weeks, 10 g/d for 3 weeks, and 15 g/d for 67 weeks. A 20-week period without added dietary salt concluded the experiment. The BP changes were significantly increased over base line (*P < 0.05, **P < 0.01, ***P < 0.001) and significantly different between groups (+P < 0.05; +++P < 0.001). Reproduced with permission from Nature Medicine (48).
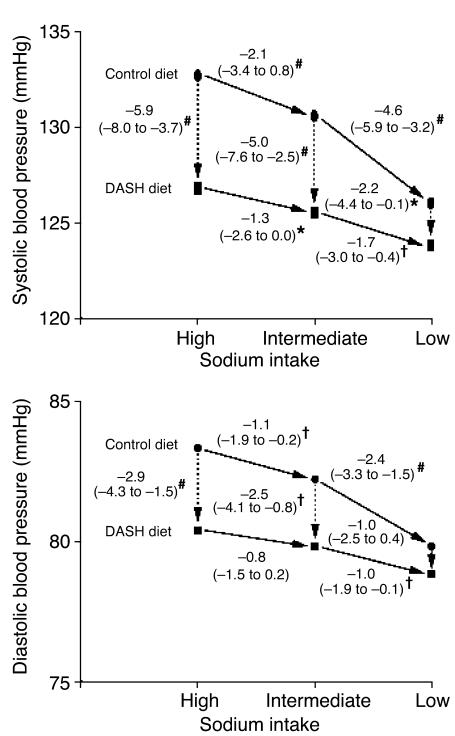
BP changes during the DASH-Sodium trial. Although arrows are unidirectional, the order in which individuals were assigned a given salt level was random with a crossover design. The numbers next to the lines connecting the data points are the mean changes in BP. The 95% confidence intervals are given in parentheses. *P < 0.05, †P < 0.01, and #P < 0.001; symbols indicate significant differences in BP between groups or between dietary sodium categories. Reproduced with permission from the New England Journal of Medicine (54).
References
-
- Taubes G. The (political) science of salt. Science. 1998;281:898–907. - PubMed
-
- Taubes G. A DASH of data in the salt debate. Science. 2000;288:1319. - PubMed
-
- Veith, I. 1949. Huang Ti Nei Ching Su Wen. The Yellow Emperor’s Classic Of Internal Medicine. Williams & Wilkins. Baltimore, Maryland, USA. 253 pp.
-
- Dahl LK, Heine M. Primary role of renal homografts in setting chronic blood pressure levels in rats. Circ. Res. 1975;36:692–696. - PubMed
-
- Guyton AC. Abnormal renal function and autoregulation in essential hypertension. Hypertension. 1991;18:49–53. - PubMed
