. 2004 Apr;113(8):1168-75.
doi: 10.1172/JCI20978.

Overexpression of Insig-1 in the livers of transgenic mice inhibits SREBP processing and reduces insulin-stimulated lipogenesis

Affiliations

Overexpression of Insig-1 in the livers of transgenic mice inhibits SREBP processing and reduces insulin-stimulated lipogenesis

Luke J Engelking et al. J Clin Invest. 2004 Apr.

Abstract

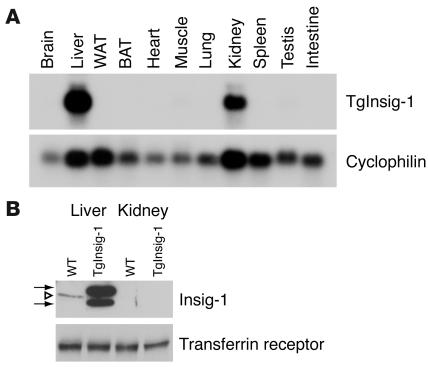
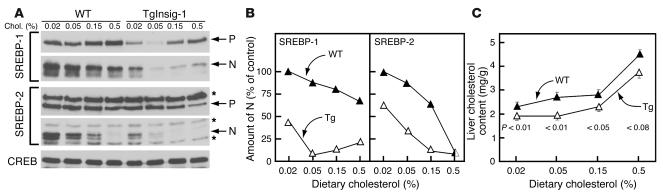
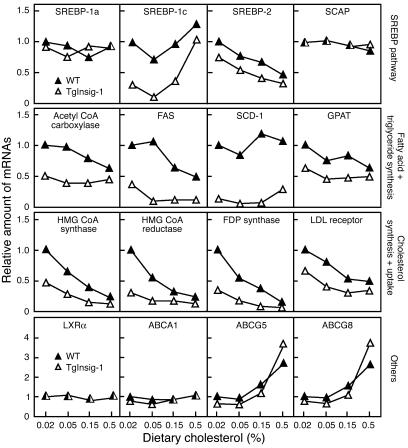
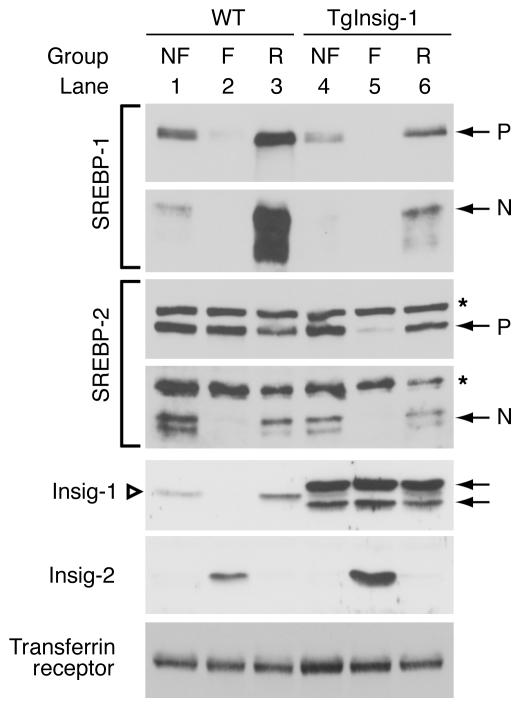
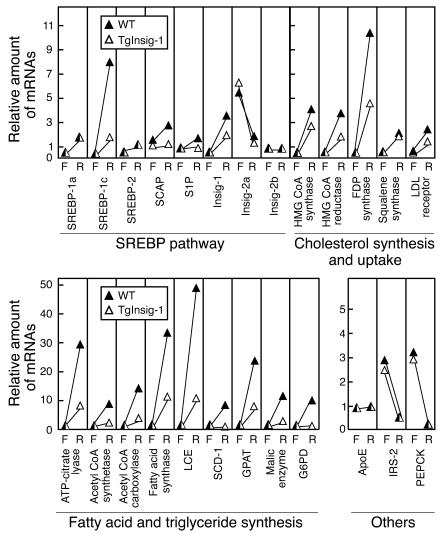
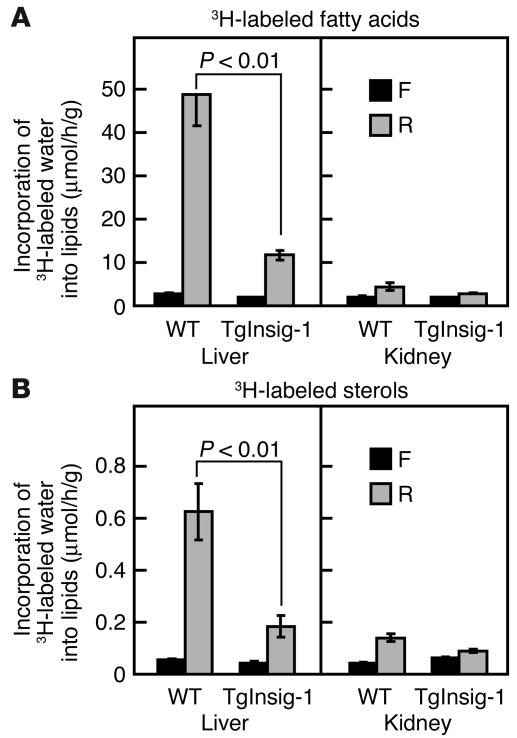
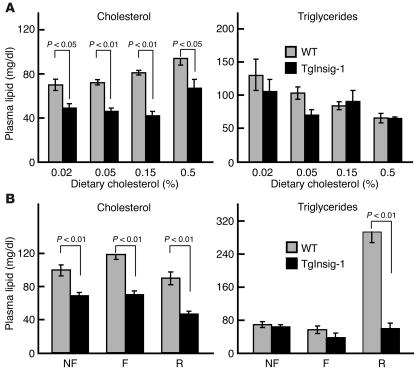
In the current studies we generated transgenic mice that overexpress human Insig-1 in the liver under a constitutive promoter. In cultured cells Insig-1 and Insig-2 have been shown to block lipid synthesis in a cholesterol-dependent fashion by inhibiting proteolytic processing of sterol regulatory element-binding proteins (SREBPs), membrane-bound transcription factors that activate lipid synthesis. Insig's exert this action in the ER by binding SREBP cleavage-activating protein (SCAP) and preventing it from escorting SREBPs to the Golgi apparatus where the SREBPs are processed to their active forms. In the livers of Insig-1 transgenic mice, the content of all nuclear SREBPs (nSREBPs) was reduced and declined further upon feeding of dietary cholesterol. The nuclear content of the insulin-induced SREBP isoform, SREBP-1c, failed to increase to a normal extent upon refeeding on a high-carbohydrate diet. The nSREBP deficiency produced a marked reduction in the levels of mRNAs encoding enzymes required for synthesis of cholesterol, fatty acids, and triglycerides. Plasma cholesterol levels were strongly reduced, and plasma triglycerides did not exhibit their normal rise after refeeding. These results provide in vivo support for the hypothesis that nSREBPs are essential for high levels of lipid synthesis in the liver and indicate that Insig's modulate nSREBP levels by binding and retaining SCAP in the ER.


Figures

Figure 1
Figure 1
Transgene expression in TgInsig-1 mice. (A) Tissue distribution of human Insig-1 transgene mRNA. Total RNA was extracted from tissues of transgenic mice consuming a chow diet. A total of 20 μg of RNA was subjected to electrophoresis and blot hybridization with 32P-labeled cDNA probes for human Insig-1 and mouse cyclophilin. After stringent washing, the membranes were exposed to Kodak X-Omat Blue XB-1 films for 4–12 hours at –80°C. (B) Immunoblot analysis of endogenous mouse Insig-1 and transgenic human Insig-1 from the livers and kidneys of WT and TgInsig-1 mice, respectively. Membrane fractions from five WT and five TgInsig-1 mice (same as those described in Table 1) were prepared and pooled as described in Methods. Aliquots of the pooled membrane fraction (45 μg protein) were subjected to SDS-PAGE and immunoblot analysis as described in Methods. Filters were exposed to Kodak X-Omat Blue XB-1 film for 15 seconds at room temperature. Open triangle denotes endogenous mouse Insig-1 (28 kDa); arrows denote transgenic human Insig-1 (doublet of 30 kDa and 26 kDa). Immunoblot of transferrin receptor served as a loading control. WAT, white adipose tissue; BAT, brown adipose tissue.
Figure 2
Figure 2
Overexpression of Insig-1 increases sensitivity of SREBP processing to inhibition by dietary cholesterol. Eight-week old female mice (four per group) were fed an ad libitum chow diet supplemented with the indicated amount of cholesterol for 2 days prior to study. The WT mice were littermates of the transgenic mice. A detailed description of these mice is provided in Supplemental Table 1. (A) Immunoblot analysis. Livers from each group (four mice per group) were pooled, and 30-μg aliquots of the membrane and nuclear extract fractions were subjected to SDS-PAGE and immunoblotted with Ab’s against SREBP-1 and SREBP-2. Chol., cholesterol; N, nSREBP; P, precursor form of SREBP. Asterisks denote nonspecific bands. CREB (cAMP-responsive element binding) protein was used as a loading control for the nuclear extract fractions (9192; Ab from Cell Signaling Technology, Beverly, Massachusetts, USA). (B) The gels of nuclear extract fractions in A were scanned and quantified by densitometry. Intensities of the cleaved nuclear forms of SREBP-1 and SREBP-2 in lane 1 (WT mice fed with 0.02% cholesterol) were arbitrarily set at 100%. (C) Cholesterol content of the livers of WT and TgInsig-1 mice fed for 2 days with the indicated amount of cholesterol. Each value represents the mean ± SEM of data from four mice. The levels of statistical significance (Student’s t test) between the WT and TgInsig-1 groups are shown as P values.
Figure 3
Figure 3
Relative amount of various mRNAs in the livers of WT and TgInsig-1 mice fed with increasing amounts of cholesterol (0.02–0.5%). The mice used here are the same as those used in Figure 2 and Supplemental Table 1. Total RNA from four mouse livers was pooled and subjected to real-time PCR quantification as described in Methods. Each value represents the amount of mRNA relative to that in WT mice fed a chow diet (0.02% cholesterol), which is arbitrarily defined as 1. FAS, fatty acid synthase; FDP, farnesyl diphosphate; GPAT, glycerol-3-phosphate acyltransferase; SCD-1, stearoyl CoA desaturase-1.
Figure 4
Figure 4
Effect of fasting and refeeding on SREBP and Insig proteins in the livers of WT and TgInsig-1 mice. Sixteen-week-old male mice (five per group) were subjected to fasting and refeeding as described in Methods. The WT mice were littermates of the transgenic mice. A detailed description of these mice is provided in Supplemental Table 2. The nonfasted group (NF) was fed a chow diet ad libitum, the fasted group (F) was fasted for 12 hours, and the refed group (R) was fasted for 12 hours and refed a high-carbohydrate/low-fat diet for 12 hours prior to study. Nuclear extract fractions were prepared from pooled livers (five mice per group); membrane fractions were prepared individually and pooled as described in Methods. Aliquots of membrane and nuclear extract fractions (45 μg) were subjected to SDS-PAGE and immunoblot analysis as described in Methods and Figures 1 and 2. Asterisks denote nonspecific bands. Open triangle denotes endogenous mouse Insig-1 (28 kDa) (lanes 1–3); arrows denote transgenic human Insig-1 (doublet of 30 kDa and 26 kDa) (lanes 4–6).
Figure 5
Figure 5
Relative amount of various mRNAs in the livers of WT and TgInsig-1 mice subjected to fasting and refeeding. The mice used here are the same as those used in Figure 4 and Supplemental Table 2. Total RNA from the livers of mice was pooled (five mice per group) and subjected to real-time PCR quantification as described in Methods. Each value represents the amount of mRNA relative to that in the nonfasted WT mice, which is arbitrarily defined as 1. For purposes of clarity, only the fasted and refed values are shown. FDP, farnesyl diphosphate; G6PD, glucose-6-phosphate dehydrogenase; LCE, long-chain fatty acyl elongase; S1P, site-1 protease. F, fasted group; R, refed group.
Figure 6
Figure 6
In vivo synthesis rates of fatty acids (A) and sterols (B) in the livers and kidneys of WT and TgInsig-1 mice subjected to fasting and refeeding. Mice (16-week old male, five per group) were either fasted for 12 hours or fasted for 12 hours and then refed a high-carbohydrate/low-fat diet for 12 hours prior to study. Each mouse was then injected intraperitoneally with 3H-labeled water (50 mCi in 0.25 ml of isotonic saline). One hour later the tissues were removed for measurement of 3H-labeled fatty acids and digitonin-precipitable sterols. Each bar represents the mean ± SEM of values from five mice. The levels of statistical significance (Student’s t test) between the WT and TgInsig-1 groups are shown as P values. F, fasted group; R, refed group.
Figure 7
Figure 7
Plasma lipid levels in WT and TgInsig-1 mice fed different amounts of cholesterol (A) or subjected to fasting and refeeding (B). Mice used in A are described in Figure 2; mice used in B are described in Figure 4. Each value is the mean ± SEM of data from four or five mice. The levels of statistical significance (Student’s t test) between the WT and TgInsig-1 groups are shown as P values. F, fasted group; R, refed group.

Comment in

References

    1. Sever N, Yang T, Brown MS, Goldstein JL, DeBose-Boyd RA. Accelerated degradation of HMG CoA reductase mediated by binding of insig-1 to its sterol-sensing domain. Mol. Cell. 2003;11:25–33. - PubMed
    1. Sever N, et al. Insig-dependent ubiquitination and degradation of mammalian 3-hydroxy-3-methylglutaryl-CoA reductase stimulated by sterols and geranylgeraniol. J. Biol. Chem. 2003;278:52479–52490. - PubMed
    1. Yang T, et al. Crucial step in cholesterol homeostasis: sterols promote binding of SCAP to INSIG-1, a membrane protein that facilitates retention of SREBPs in ER. Cell. 2002;110:489–500. - PubMed
    1. Yabe D, Brown MS, Goldstein JL. Insig-2, a second endoplasmic reticulum protein that binds SCAP and blocks export of sterol regulatory element-binding proteins. Proc. Natl. Acad. Sci. U. S. A. 2002;99:12753–12758. - PMC - PubMed
    1. Horton JD, et al. Combined analysis of olignucleotide microarray data from transgenic and knockout mice identifies direct SREBP target genes. Proc. Natl. Acad. Sci. U. S. A. 2003;100:12027–12032. - PMC - PubMed

Publication types