. 2004 Apr;113(8):1176-87.
doi: 10.1172/JCI20345.

Altered lipid raft-associated signaling and ganglioside expression in T lymphocytes from patients with systemic lupus erythematosus

Affiliations

Altered lipid raft-associated signaling and ganglioside expression in T lymphocytes from patients with systemic lupus erythematosus

Elizabeth C Jury et al. J Clin Invest. 2004 Apr.

Abstract

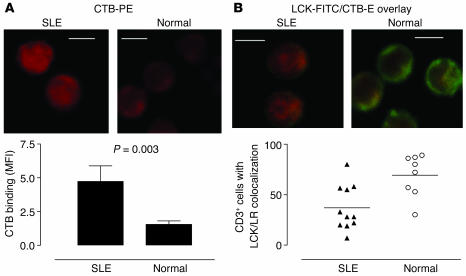
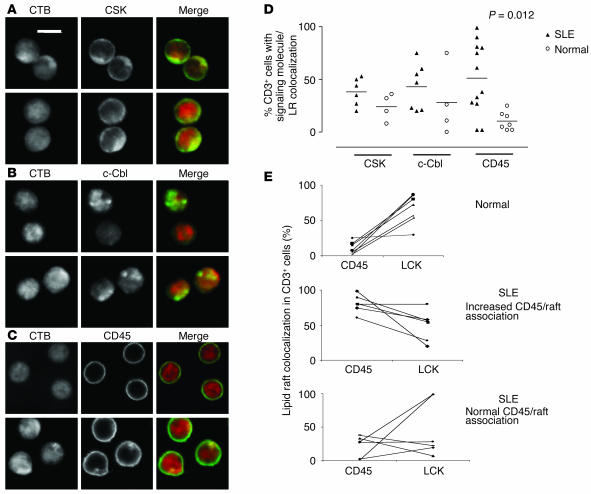
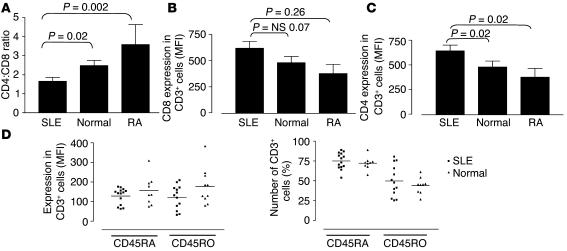
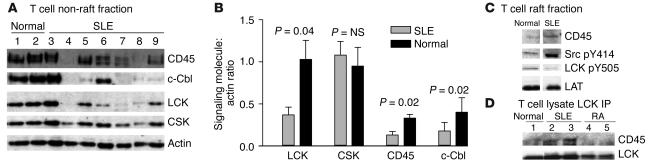
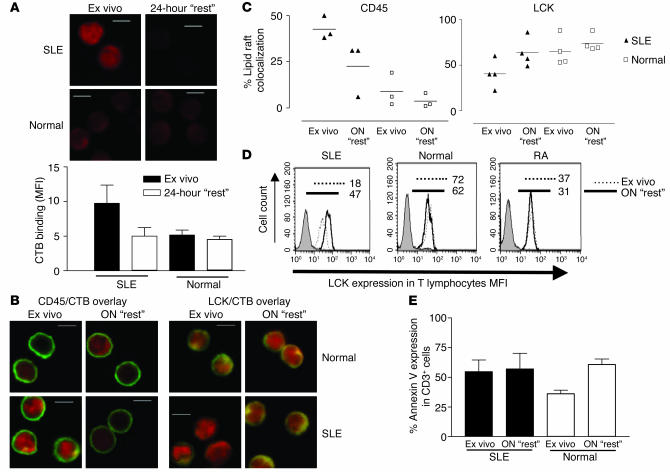
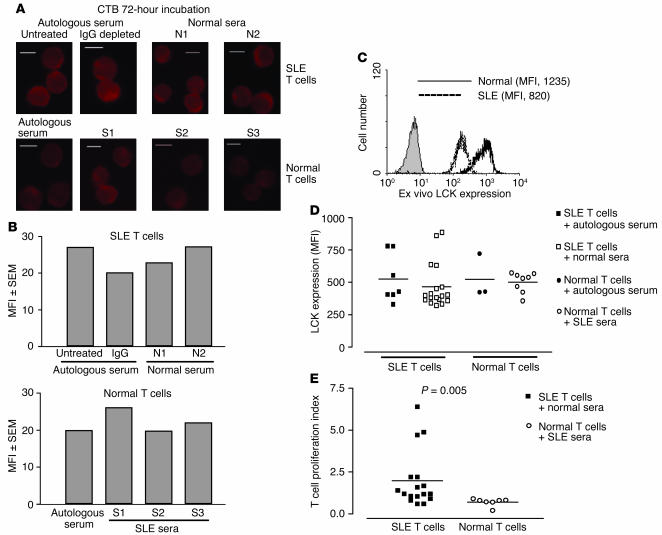
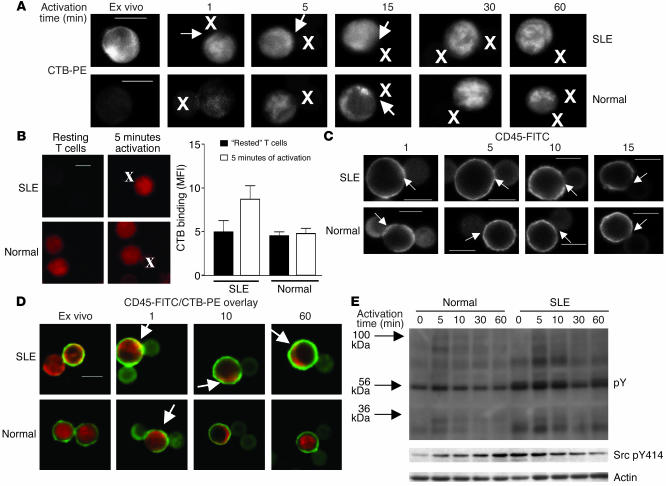
Systemic lupus erythematosus (SLE) is characterized by abnormalities in T lymphocyte receptor-mediated signal transduction pathways. Our previous studies have established that lymphocyte-specific protein tyrosine kinase (LCK) is reduced in T lymphocytes from patients with SLE and that this reduction is associated with disease activity and parallels an increase in LCK ubiquitination independent of T cell activation. This study investigated the expression of molecules that regulate LCK homeostasis, such as CD45, C-terminal Src kinase (CSK), and c-Cbl, in lipid raft domains from SLE T cells and investigated the localization of these proteins during T cell receptor (TCR) triggering. Our results indicate that the expression of raft-associated ganglioside, GM1, is increased in T cells from SLE patients and LCK may be differentially regulated due to an alteration in the association of CD45 with lipid raft domains. CD45 tyrosine phosphatase, which regulates LCK activity, was differentially expressed and its localization into lipid rafts was increased in T cells from patients with SLE. Furthermore, T cells allowed to "rest" in vitro showed a reversal of the changes in LCK, CD45, and GM1 expression. The results also revealed that alterations in the level of GM1 expression and lipid raft occupancy cannot be induced by serum factors from patients with SLE but indicated that cell-cell contact, activating aberrant proximal signaling pathways, may be important in influencing abnormalities in T cell signaling and, therefore, function in patients with SLE.


Figures

Figure 1
Figure 1
Increased GM1 expression and reduced colocalization of LCK with lipid raft (LR) domains in T cells from patients with SLE. Purified T cells from 12 patients with SLE, 8 healthy controls, and 6 patients with RA were fixed, made permeable, and stained for LCK-FITC by indirect immunofluorescence; lipid rafts were visualized using PE-conjugated CTB. Cells were viewed by confocal microscopy, and images were analyzed for individual LCK or CTB staining patterns and for areas of colocalization (yellow color); quantitative results are based on the “reading” of an average of 50 cells for each sample. (A) Representative experiment showing CTB binding in SLE T cells compared with control T cells (Normal) (upper panels). Semiquantitation of CTB binding is shown using MFI (± SEM); five images were analyzed from five patients with SLE and four healthy controls (lower panel). (B) LCK/CTB overlay images comparing SLE and normal T cells (Normal) (upper panels). Quantitative results showing the percent of CD3+ cells displaying areas of LCK/LR colocalization in SLE patients and healthy controls; each symbol represents one patient with an average of 50 cells analyzed (lower panel). Scale bars, 5 μm.
Figure 2
Figure 2
Altered association of CD45 with LR domains in T cells from patients with SLE. Purified T cells from 12 patients with SLE and 8 healthy controls were examined as described in Figure 1 for CSK, c-Cbl, and CD45. (A–C) Representative experiment showing colocalization of CSK (A), c-Cbl (B), and CD45 (C) to LR domains in SLE and normal T cells (Normal). Scale bars, 5 μm. (D) Quantitative results showing the percent of CD3+ cells displaying areas of CSK, c-Cbl, and CD45 colocalization with lipid rafts in patients with SLE and healthy controls (Normal). On average, 50 cells were analyzed for each individual sample. (E) Correlation between CD45 and LCK colocalization with rafts domains in individual samples; on average, 50 cells were assessed from each patient or control. T cells from normal controls (top panel), patients with SLE with an increased CD45/LR association (middle panel), and SLE patients with normal CD45/LR colocalization (bottom panel).
Figure 3
Figure 3
T cells from patients with SLE have an altered phenotype. T lymphocytes from 14 patients with SLE, 12 healthy controls (Normal), and 6 patients with RA were analyzed for expression of CD4, CD8, CD45RA, and CD45RO by flow cytometry. (A) The relative proportions of T cells expressing CD4 or CD8 were expressed as a ratio (CD4:CD8). (B and C) The level of expression of both CD8 (B) and CD4 (C), as determined by MFI, on T cells from patients with SLE or RA and from healthy controls. (D) The level of expression of CD45RA and CD45RO (MFI) on CD3+ cells (left panel) and the number (%) of CD3+ cells expressing CD45RA and CD45RO (right panel). All results are expressed as mean ± SEM.
Figure 4
Figure 4
CD45 has an altered pattern of expression and membrane localization in T cells from patients with SLE. Lipid raft and non-raft fractions were prepared from T cells from patients with SLE and controls (Normal). Fractions were separated by 8% SDS-PAGE and analyzed by Western blotting. (A) A representative experiment showing T cell non-raft fractions from patients with SLE and healthy controls analyzed by Western blot for CD45, LCK, c-Cbl, and CSK. Actin was used as a control for equal protein loading. (B) Graph displaying cumulative semiquantitative results for CD45, CSK, c-Cbl, and LCK expression in T cell non-raft fractions from ten SLE patients and five healthy controls. The relative levels of LCK, CSK, CD45, and c-Cbl were estimated by comparison of the intensity of each band to that of the actin control. (C) Western blot representative of three experiments showing expression of CD45, active LCK (Src pY414), and inactive LCK (LCK pY505) in T cell lipid rafts. LAT expression is not altered in SLE T cells (26) and is used as a marker of equal protein loading. (D) LCK was immunoprecipitated from 50-μg fractions of whole–T cell lysates for patients with SLE and controls (Normal and RA). Immunoprecipitates (IP) were analyzed by Western blot and probed for CD45 and LCK.
Figure 5
Figure 5
In vitro culture of SLE T cells normalizes expression of GM1 and LCK. T lymphocytes from four patients with SLE and four healthy volunteers (Normal) were analyzed by confocal microscopy either ex vivo or after overnight (ON) “rest”. (A) Representative microscopy images showing CTB binding in SLE and normal T cells analyzed ex vivo and after 24 hours of “rest” (upper panels). The CTB binding intensity, measured by MFI (± SEM), in three representative images from three patients with SLE and three healthy controls is shown (lower panel). (B) Representative microscopy images showing CD45/CTB and LCK/CTB colocalization in SLE and normal T cells analyzed ex vivo and after 24 hours of “rest”. In A and B: scale bars, 5 μm; X on confocal images represents position of activating bead. (C) Semiquantitative results from four patients with SLE and four healthy controls. On average, 25 cells from each sample were assessed for areas of CD45/CTB or LCK/CTB colocalization. (D) The effect of overnight “rest” on T cell LCK expression was measured by flow cytometry. T cells (106) were stained with anti-CD3–PE followed by rabbit anti-LCK or isotype control and FITC-conjugated anti–mouse Ig. Results are expressed as MFI. Figure is representative of three experiments. Numbers indicate MFI. (E) T cell apoptosis was assessed in five patients with SLE and five healthy controls. Cells were labeled with annexin V-FITC and propidium iodide and were analyzed by flow cytometry. Results are expressed as percent of CD3+ cells expressing annexin V (mean ± SEM).
Figure 6
Figure 6
The effect of soluble serum factors on T cell GM1 and LCK expression and T cell proliferation. T lymphocytes from lupus patients and controls were cultured for 72 hours with 50% sterile human serum. Some SLE sera were depleted of IgG using protein G–sepharose to remove autoantibodies. Cells were recovered and were fixed for confocal microscopy or were analyzed for LCK expression by flow cytometry. (A) Representative confocal microscopy images showing binding of CTB to GM1 in SLE and normal T cells cultured for 72 hours in autologous, normal, or SLE sera. Scale bars, 5 μm. N1, N2, sera from two different healthy controls; S1, S2, S3, sera from three different SLE patients. (B) Semiquantitation of CTB binding (MFI) of the images shown in A. (C) Representative experiment showing ex vivo expression of LCK (MFI) in T cells from SLE patients and controls. (D) Cumulative results showing LCK expression (MFI) in SLE and normal T cells after 72 hours in culture with autologous, normal, or SLE sera. (E) T cells recovered from incubation with 50% human sera were activated for 3 days with anti-CD3 and anti-CD28 and were pulsed with [3H]TdR. After 18 hours, cells were harvested and [3H]TdR incorporation was measured. Results are shown as a proliferation index (proliferation in autologous serum/proliferation in normal or SLE serum).
Figure 7
Figure 7
The effect of T cell activation on GM1 expression and location of CD45. T cells from patients with SLE and healthy controls (Normal) were activated using magnetic beads coated with anti-CD3 and anti-CD28 for 1, 5, 10, 15, 30, and 60 minutes. Activated cells were subsequently fixed for confocal microscopy or lysed for analysis by Western blotting. (A) Figure representative of three experiments showing T cell expression of CTB during TCR activation. (B) T cells from patients with SLE or normal controls were allowed to “rest” overnight in complete medium, then were fixed for confocal microscopy analysis or were activated using magnetic beads coated with anti-CD3 and anti-CD28 for 5 minutes. Activated cells were then fixed for confocal microscopy. The images are representative of four experiments. The bar graph shows semiquantitation of CTB binding (MFI ± SEM) in five representative images examined from each of four patients with SLE and four healthy controls. (C) Figure representative of three experiments showing T cell expression of CD45 during TCR activation. (D) CD45/CTB overlay images comparing SLE and normal T cells after TCR activation; yellow color indicates areas of colocalization. (E) Proteins from T cell lysates were separated by 8% SDS-PAGE, transferred to PVDF membranes, and probed with antibodies against phosphotyrosine (pY) and active LCK (Src pY414) and against actin as a control for equal protein loading (Actin). Scale bars, 5 μm. X on confocal images represents position of activating bead.

References

    1. Morrow, J., Nelson, L., Watts, R., and Isenberg, D. 1999. Systemic lupus erythematosus. In Autoimmune rheumatic disease. 2nd edition. Oxford University Press. Oxford, United Kingdom. 56–103.
    1. Dayal AK, Kammer GM. The T cell enigma in lupus. Arthritis Rheum. 1996;39:23–33. - PubMed
    1. Tsokos GC, Liossis SN. Immune cell signalling defects in lupus: activation, anergy and death. Immunol. Today. 1999;20:119–124. - PubMed
    1. Simons K, Ikonen E. Functional rafts in cell membranes. Nature. 1997;387:569–572. - PubMed
    1. Simons K, Toomre D. Lipid rafts and signal transduction. Nat. Rev. Mol. Cell Biol. 2000;1:31–39. - PubMed

Publication types

Substances