. 2004 Apr 27;101(17):6582-6.
doi: 10.1073/pnas.0308181101. Epub 2004 Apr 15.

Regulation of ultraviolet light-induced gene expression by gene size

Affiliations

Regulation of ultraviolet light-induced gene expression by gene size

Bruce C McKay et al. Proc Natl Acad Sci U S A. .

Abstract

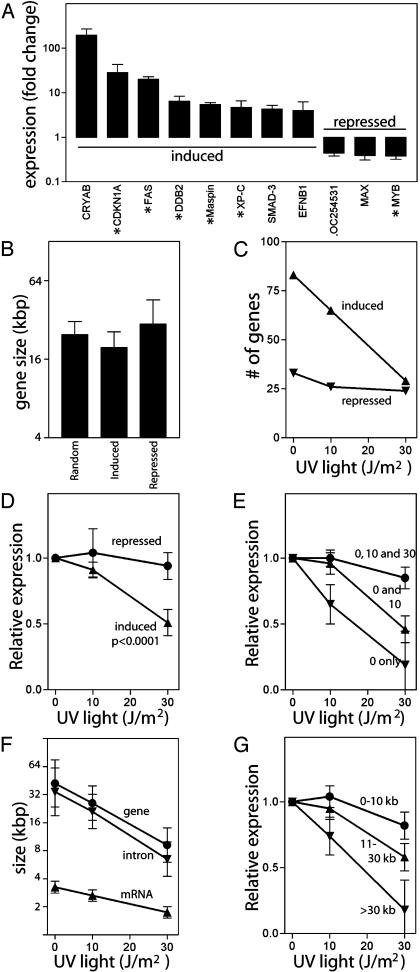
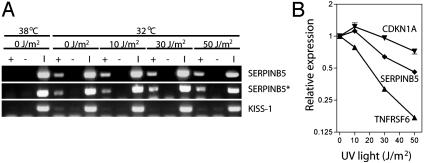
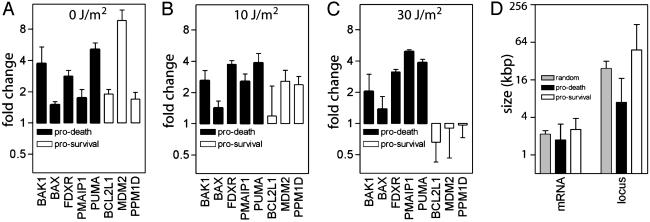
UV light induces the expression of a wide variety of genes. At present, it is unclear how cells sense the extent of DNA damage and alter the expression of UV-induced genes appropriately. UV light induces DNA damage that blocks transcription, and the probability that a gene sustains transcription-blocking DNA damage is proportional to locus size and dose of UV light. Using colon carcinoma cells that express a temperature-sensitive variant of p53 and undergo p53-dependent apoptosis after UV irradiation, we found that the number of p53-induced genes identified by oligonucleotide microarray analysis decreased in a UV dose-dependent manner. This was associated with a statistically significant shift in the spectrum of p53-induced genes toward compact genes with fewer and smaller introns. Genes encoding proapoptotic proteins involved in the initiation of the mitochondrial apoptotic cascade were prominent among the compact p53 target genes, whereas genes encoding negative regulators of p53 and the mitochondrial apoptotic pathway were significantly larger. We propose that the shift in spectrum of UV-responsive gene expression caused by passive effects of UV lesions on transcription acts as a molecular dosimeter, ensuring the elimination of cells sustaining irreparable transcription-blocking DNA damage.


Figures

Fig. 1.
Fig. 1.
The effect of UV light on expression of genes induced at the permissive temperature. (A) Fold increase in gene expression at the permissive temperature was determined by real-time RT-PCR. Known p53-regulated genes are denoted with asterisks. (B) The mean size of genes induced or repressed at the permissive temperature compared to the size of randomly selected genes. The effect of the UV light on the number (C) and expression (D) of genes induced or repressed at the permissive temperature. Expression in D for each gene was determined and normalized to the induced level of expression of that gene at the permissive temperature alone and is expressed as the mean level of expression determined from all genes in the group. (E) Genes were grouped by behavior to UV light: induced at 0 (inverted triangle), 0 and 10 (triangle), or 0, 10, and 30 (circle) J/m2. Relative expression was determined as indicated in D. (F) The mean size of loci (circles), mean size of mRNA (triangles), and the total intron size (inverted triangles) are indicated for each group in E. (G) Genes were sorted into three groups by gene size (≤10 kb, 11-30 kb, and >30 kb, n = 28, 26, and 27, respectively) and the mean effect of UV light on gene expression in each group was determined. Error bars in A and D-G indicate the 95% confidence interval of the indicated mean. The P value in D was determined by one-way ANOVA.
Fig. 2.
Fig. 2.
The effect of UV dose on p53 binding and p53 target gene expression. (A) Representative chromatin immunoprecipitation experiments demonstrate an interaction of p53 and ser15 phosphorylated p53 (asterisk) with the SERPINB5 p53-response element at all doses of UV light. KiSS-1 served as a negative control. +, antibody; -, the no-antibody control; I, input DNA. (B) The effect of UV light on representative p53 target genes was determined by real-time RT-PCR. Values are expressed relative to the corresponding mean determined for p53 target genes induced at the permissive temperature alone. Values represent the mean ± standard error.
Fig. 3.
Fig. 3.
p53 target genes involved in mitochondrial apoptotic pathways are resistant to inhibition of gene expression by UV light. (A-C) The fold change in the expression of genes encoding antiapoptotic (open symbols) and proapoptotic (filled symbols) proteins after exposure to 0 (A), 10 (B), or 30 (C)J/m2. (D) The mean size of the mRNA and locus of genes encoding p53-regulated proapoptotic proteins or survival promoting proteins (in A-C).

References

    1. Venter, J. C., Adams, M. D., Myers, E. W., Li, P. W., Mural, R. J., Sutton, G. G., Smith, H. O., Yandell, M., Evans, C. A., Holt, R. A., et al. (2001) Science 291, 1304-1351. - PubMed
    1. Tornaletti, S. & Hanawalt, P. (1999) Biochimie 81, 139-146. - PubMed
    1. Mayne, L. & Lehmann, A. (1982) Cancer Res. 42, 1473-1478. - PubMed
    1. Ljungman, M. & Zhang, F. (1996) Oncogene 13, 823-831. - PubMed
    1. McKay, B. C., Chen, F., Clarke, S. T., Wiggin, H. E., Harvey, L. M. & Ljungman, M. (2001) Mutat. Res. 485, 93-105. - PubMed

Publication types