

Design and analysis of admixture mapping studies
- PMID: 15088268
- PMCID: PMC1181989
- DOI: 10.1086/420855
Design and analysis of admixture mapping studies
Abstract
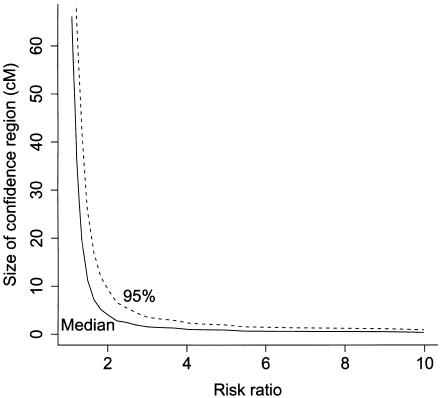
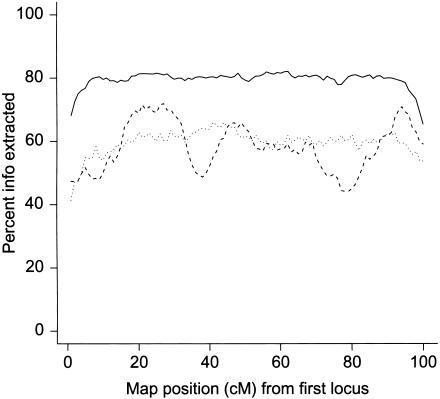
Admixture between populations originating on different continents can be exploited to detect disease susceptibility loci at which risk alleles are distributed differentially between these populations. We first examine the statistical power and mapping resolution of this approach in the limiting situation in which gamete admixture and locus ancestry are measured without uncertainty. We show that, for a rare disease, the most efficient design is to study affected individuals only. In a typical African American population (two-way admixture proportions 0.8/0.2, ancestry crossover rate 2 per 100 cM), a study of 800 affected individuals has 90% power to detect at P values <10(-5) a locus that generates a risk ratio of 2 between populations, with an expected mapping resolution (size of 95% confidence region for the position of the locus) of 4 cM. In practice, to infer locus ancestry from marker data requires Bayesian computationally intensive methods, as implemented in the program ADMIXMAP. Affected-only study designs require strong prior information on the frequencies of each allele given locus ancestry. We show how data from unadmixed and admixed populations can be combined to estimate these ancestry-specific allele frequencies within the admixed population under study, allowing for variation between allele frequencies in unadmixed and admixed populations. Using simulated data based on the genetic structure of the African American population, we show that 60% of information can be extracted in a test for linkage using markers with an ancestry information content of 36% at 3-cM spacing. As in classic linkage studies, the most efficient strategy is to use markers at a moderate density for an initial genome search and then to saturate regions of putative linkage with additional markers, to extract nearly all information about locus ancestry.
Figures


References
Electronic-Database Information
-
- Genetic Epidemiology Group, London School of Hygiene & Tropical Medicine, http://www.lshtm.ac.uk/eu/genetics/index.html (for the ADMIXMAP program)
References
-
- Cavalli-Sforza LL, Menoozz P, Piazzi A (1994) The history and geography of human genes. Princeton University Press, Princeton
-
- Gilks WF, Wild P (1992) Adaptive rejection sampling for Gibbs sampling. Appl Statist 41:337–348
Publication types
MeSH terms
Substances
Grants and funding
LinkOut - more resources
Full Text Sources
Other Literature Sources
Medical
Research Materials
