

MR imaging and proton MR spectroscopic studies in Sjögren-Larsson syndrome: characterization of the leukoencephalopathy
- PMID: 15090362
- PMCID: PMC7975598
MR imaging and proton MR spectroscopic studies in Sjögren-Larsson syndrome: characterization of the leukoencephalopathy
Abstract
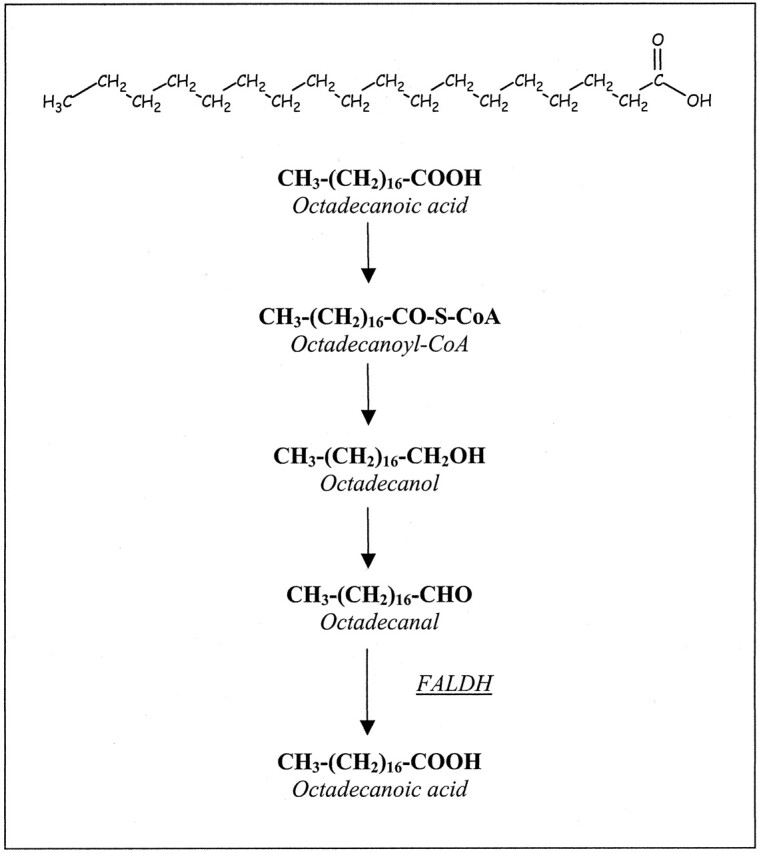
Background and purpose: Sjögren-Larsson syndrome (SLS) is a neurocutaneous syndrome caused by a genetic enzyme deficiency in lipid metabolism. Our purpose was to characterize the nature of the cerebral involvement in SLS.
Methods: MR imaging was performed in 18 patients (aged 5 months to 45 years) and repeated in 14. Single-voxel proton MR spectra were acquired from cerebral white matter and gray matter in 16 patients, with follow-up studies in 11. LCModel fits were used to determine brain metabolite levels.
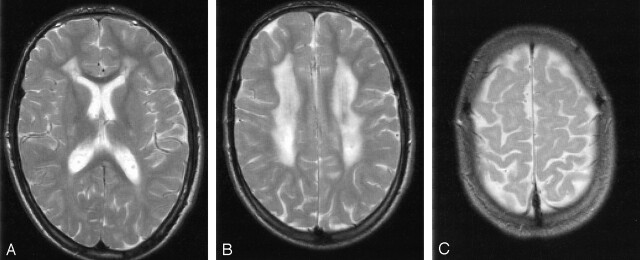
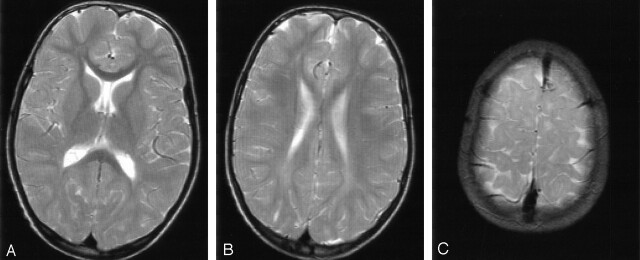
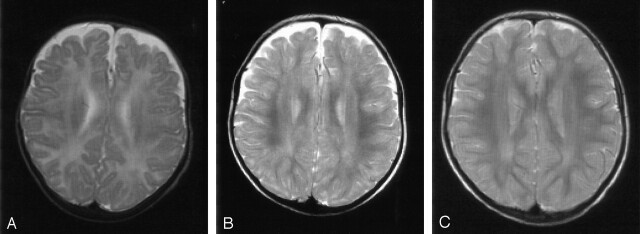
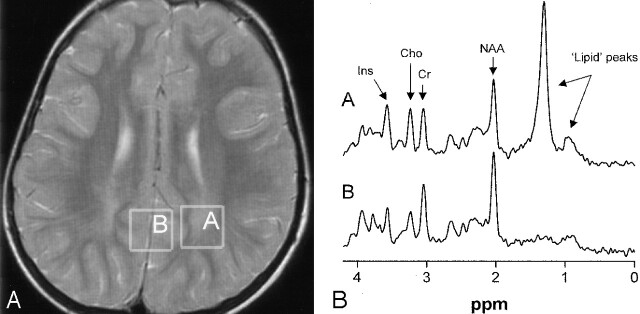
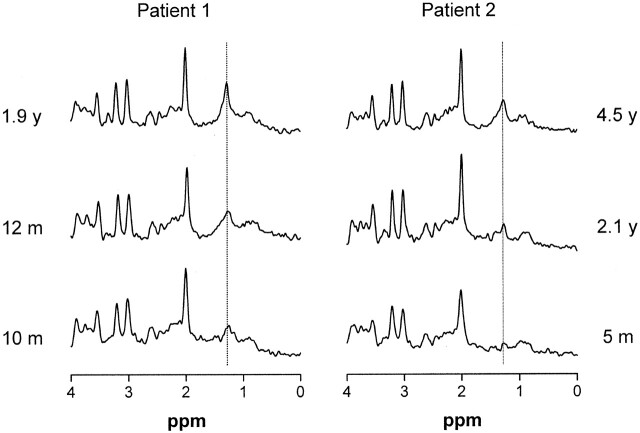
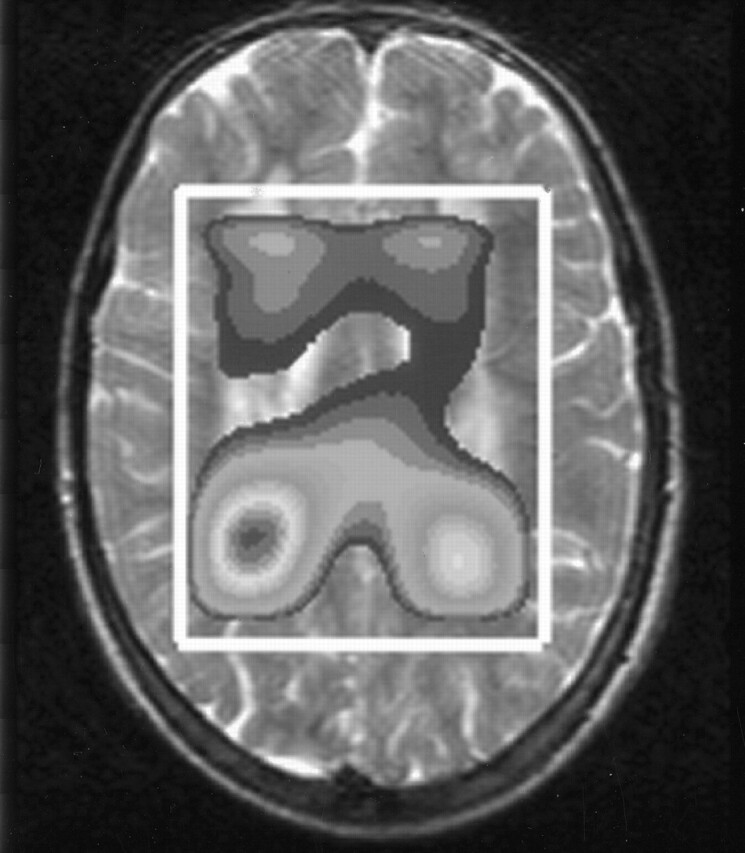
Results: MR imaging showed retardation of myelination and a mild persistent myelin deficit. A zone of increased signal intensity was seen in the periventricular white matter on T2-weighted images. Proton MR spectroscopy of white matter revealed a prominent peak at 1.3 ppm, normal levels of N-acetylaspartate, and elevated levels of creatine (+14%), choline (+18%), and myo-inositol (+54%). MR imaging and proton MR spectroscopy of gray matter were normal. In the two patients examined during the first years of life, abnormalities on MR imaging and proton MR spectroscopy gradually emerged and then stabilized, as in all other patients.
Conclusion: Abnormalities on MR imaging and proton MR spectroscopy emerge during the first years of life and are similar in all patients with SLS, but the severity varies. The changes are confined to cerebral white matter and suggest an accumulation of lipids, periventricular gliosis, delayed myelination, and a mild permanent myelin deficit.
Figures
References
-
- Sjögren T, Larsson T. Oligophrenia in combination with congenital ichthyosis and spastic disorders. Acta Psych Neurol Scand 1957;32 suppl(113):1–113 - PubMed
-
- Jagell S, Gustavson KH, Holmgren G. Sjögren-Larsson syndrome in Sweden: a clinical, genetic and epidemiological study. Clin Genet 1981;19:233–256 - PubMed
-
- Van Domburg PHMF, Willemsen MAAP, Rotteveel JJ, et al. Sjögren-Larsson syndrome: clinical and MRI/MRS spectroscopy findings in FALDH deficient patients. Neurology 1999;52:1345–1352 - PubMed
-
- Willemsen MAAP, Cruysberg JRM, Rotteveel JJ, Aandekerk AL, van Domburg PHMF, Deutman AF. Juvenile macular dystrophy associated with deficient activity of fatty aldehyde dehydrogenase in Sjögren-Larsson syndrome. Am J Ophthalmol 2000;130:782–789 - PubMed
-
- Willemsen MAAP, IJlst L, Steijlen PM, et al. Clinical, biochemical and molecular genetic characteristics of 19 patients with the Sjogren-Larsson syndrome. Brain 2001;124:1426–1437 - PubMed
MeSH terms
Substances
LinkOut - more resources
Full Text Sources
Medical