. 2004 Jun 15;557(Pt 3):991-1011.
doi: 10.1113/jphysiol.2003.059972. Epub 2004 Apr 16.

Nerve injury reduces responses of hypoglossal motoneurones to baseline and chemoreceptor-modulated inspiratory drive in the adult rat

Affiliations

Nerve injury reduces responses of hypoglossal motoneurones to baseline and chemoreceptor-modulated inspiratory drive in the adult rat

David González-Forero et al. J Physiol. .

Abstract

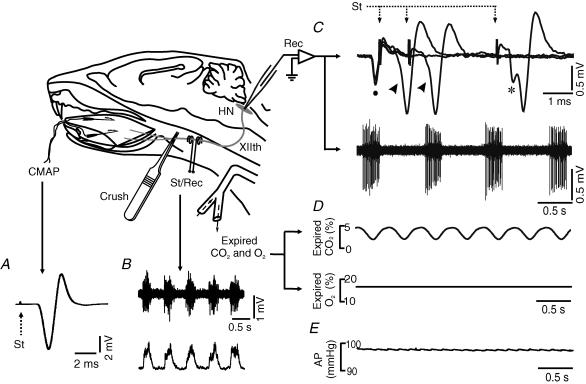
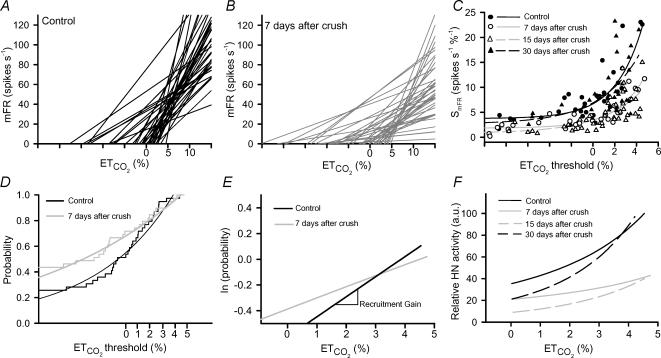
The effects of peripheral nerve lesions on the membrane and synaptic properties of motoneurones have been extensively studied. However, minimal information exists about how these alterations finally influence discharge activity and motor output under physiological afferent drive. The aim of this work was to evaluate the effect of hypoglossal (XIIth) nerve crushing on hypoglossal motoneurone (HMN) discharge in response to the basal inspiratory afferent drive and its chemosensory modulation by CO(2). The evolution of the lesion was assessed by recording the compound muscle action potential evoked by XIIth nerve stimulation, which was lost on crushing and then recovered gradually to control values from the second to fourth weeks post-lesion. Basal inspiratory activities recorded 7 days post-injury in the nerve proximal to the lesion site, and in the nucleus, were reduced by 51.6% and 35.8%, respectively. Single unit antidromic latencies were lengthened by lesion, and unusually high stimulation intensities were frequently required to elicit antidromic spikes. Likewise, inspiratory modulation of unitary discharge under conditions in which chemoreceptor drive was varied by altering end-tidal CO(2) was reduced by more than 60%. Although the general recruitment scheme was preserved after XIIth nerve lesion, we noticed an increased proportion of low-threshold units and a reduced recruitment gain across the physiological range. Immunohistochemical staining of synaptophysin in the hypoglossal nuclei revealed significant reductions of this synaptic marker after nerve injury. Morphological and functional alterations recovered with muscle re-innervation. Thus, we report here that nerve lesion induced changes in the basal activity and discharge modulation of HMNs, concurrent with the loss of afferent inputs. Nevertheless, we suggest that an increase in membrane excitability, reported by others, and in the proportion of low-threshold units, could serve to preserve minimal electrical activity, prevent degeneration and favour axonal regeneration.


Figures

Figure 1
Figure 1. Schematic diagram of the experimental preparations
In the first experimental approach, the compound muscle action potential (CMAP; A) and the XIIth nerve activity (B, upper trace) were recorded in anaesthetized animals by means of electrodes implanted in the genioglossus muscle and in the XIIth nerve (St/Rec), respectively. Analysis of burst activity in neurograms was performed on the integrated XIIth nerve signal (B, lower trace). In the second experimental approach, unitary discharge activity of hypoglossal motoneurones (HMNs; C, lower trace), expired CO2 and O2 (D) and arterial pressure (AP; E) were obtained in decerebrated, vagotomized rats, which had been injected with a neuromuscular blocking agent and lightly anaesthetized. Hypoglossal motoneurones were identified by their antidromic activation from the electrode (St/Rec) implanted in the XIIth nerve and by the collision test (C, upper trace) between spontaneous orthodromic (•) and evoked antidromic action potentials (*). Shortening the interval between these resulted in antidromic spike occlusion (arrowheads). Arrows in A and C indicate stimulus artifact. HN, hypoglossal nucleus.
Figure 2
Figure 2. Characterization of firing properties of the hypoglossal motoneurones
From top to bottom, traces represent the extracellularly recorded spike discharge for a control inspiratory hypoglossal motoneurone, the instantaneous firing rate (FR, in spikes s−1; bin width = 25 μs) and the partial pressures of CO2 and O2 as a percentage of the expired air, respectively. End-tidal CO2 (ETCO2) is indicated on the CO2 record as a dashed line. Mean (mFR) and peak (pFR) firing rates, and number of spikes (SB) in each burst, as well as burst (DB) and cycle durations, were measured. Burst and cycle parameters were analysed in relation to simultaneous ETCO2 measurements.
Figure 3
Figure 3. Time course of muscle re-innervation following XIIth nerve crushing
A–D, compound muscle action potentials (CMAPs) evoked by single shock stimulation (arrow) of XIIth nerve in control condition and at indicated post-lesion times. For comparison, muscle responses following left (L, control side) and right (R, experimental side) XIIth nerve stimulation are illustrated. E and F, time course of changes and recovery in the mean CMAP amplitude (E, expressed as percentage of control) and latency (F, expressed as difference from control side) following XIIth nerve lesion. Values are means ± s.e.m. for 3 animals. *Statistically significant differences (P < 0.05; non-parametric Mann-Whitney U test) with respect to the control (C, unoperated) group.
Figure 4
Figure 4. Time course of changes in nerve activity following XIIth nerve crushing
A, bilateral recordings from XIIth nerves and their integrated signal in control condition, and at indicated post-lesion times. R and L indicate right (experimental) and left (control) sides, respectively. B–D, time course of changes in the mean values for the burst area (B), 10–90% slope (Slope10–90; C) and duration (BW; D), measured on the integrated hypoglossal nerve discharge, after XIIth nerve crushing (○), relative to control (C, ▵) and sham (•) groups. Insets: grey traces, integrated burst activity; dotted traces, automatically adjusted parabola (see details in Methods). In D, differences (in ms) between crushed and control sides are indicated in the ordinate. Values represent means ± s.e.m. for 3 animals. *Statistically significant differences (P < 0.05; Mann-Whitney U test) with respect to the control (unoperated) group.
Figure 5
Figure 5. Axonal conduction alterations after XIIth nerve crushing
A, representative antidromic activations (*) and collisions (arrowhead) in motoneurones recorded in control, and at number of days indicated after XIIth nerve crushing. Note that activation latency, measured as the time difference between XIIth nerve stimulation (St) and the negative peak of the antidromic spike (*), was longer in motoneurones recorded after nerve lesion. B, histograms showing the distribution and mean values (↓) of the antidromic activation latencies obtained in the control (n = 112), and at 7 (n = 55), 15 (n = 65) and 30 (n = 55) days post-lesion. C, time course of changes in the antidromic activation latency (means ±s.e.m.) after XIIth nerve crushing (○), relative to the control (C, ▵) and sham (•) groups. *Significant differences (P < 0.05; one-way ANOVA; post hoc Dunnett's method) relative to control group.
Figure 6
Figure 6. Basal firing activity of the hypoglossal motoneurones
A–C, representative examples showing the discharge activity of hypoglossal motoneurones recorded at basal conditions (ETCO2= 4.8–5.2%) in the control (A), and at 7 (B) and 30 days (C) following ipsilateral XIIth nerve crushing. For each panel, from top to bottom, traces are the raw signals of extracellularly recorded spike activity, the histogram of instantaneous firing rate (FR, in spikes s−1) and the percentage of CO2 (continuous line) and ETCO2 (dashed line) in the expired air. Time scale for all recordings is shown in A. D, time course of alterations in the mean FR (mFR) per burst, as measured in basal conditions, following XIIth nerve crushing (○), relative to the control (C, ▵) and sham (•) groups. Values represent means ± s.e.m. *Significant differences (P < 0.05; one-way ANOVA; post hoc Dunnett's method) relative to the control group. E, plot of mFR versus neurogram area (both expressed as percentage of control) including data points corresponding to the control, sham, and 3, 7, 15 and 30 days post-lesion groups. For each point, the average mFR was calculated from the whole sample of units recorded (n = 18–53) in decerebrated and vagotomized animals under neuromuscular blockade, and the neurogram area as the mean value for the neurographic recordings (n = 3) in anaesthetized animals in the same conditions. This relationship was fitted by the regression line: y =−14.0 + 1.12x (r = 0.98; P < 0.0001).
Figure 7
Figure 7. Effects of XIIth nerve crushing on the CO2-modulated response of hypoglossal motoneurones
A and B, discharge activity modulation at different ETCO2 levels for a control motoneurone (A) and for a motoneurone recorded 7 days after crushing (B). Traces represent the extracellular unitary activity (upper trace), the instantaneous firing rate (FR, in spikes s−1; middle trace) and the percentage expired CO2 (continuous line; lower trace) and ETCO2 (dashed line). C, plots showing the relationships between mean FR (mFR) per burst and ETCO2 for the motoneurones illustrated in A (•) and B (○). D, same as C, but after grouping and averaging data at 0.2% intervals of ETCO2. The slopes of the regression lines represent the neuronal sensitivity or gain to ETCO2 changes (SmFR, in spikes s−1%−1). Regression lines are mFR =−12.27 + 8.44 ETCO2 (r = 0.97; P < 0.0001) in control and mFR = 5.68 + 2.45 ETCO2 (r = 0.92; P < 0.0001) in the experimental motoneurone. E, graph representing the time course of changes in SmFR (mean ± s.e.m.) following XIIth nerve crushing (○), relative to the control (C, ▵) and sham (•) groups. *Statistically significant differences (P < 0.05; one-way ANOVA; post hoc Dunnett's method) relative to control values.
Figure 8
Figure 8. Effects of XIIth nerve crushing on recruitment of hypoglossal motoneurones
A and B, collection of linear regression lines of mean firing rate (mFR) versusETCO2 including the whole analysed pools in control (A) and at 7 days after crushing (B). The abscissa intercept for each line indicates the theoretical recruitment threshold. C, plots reflecting the relationships between SmFR values (in spikes s−1%−1) and the recruitment thresholds for the motoneuronal groups sampled in the control and at 7, 15 and 30 days after crushing. Data point distributions were best fitted by exponential functions (P < 0.0001) whose regression curves were: y = 3.75 + 2.95exp(0.40x) (r = 0.83), y = 1.83 + 1.63exp(0.38x) (r = 0.92), y = 0.81 + 2.63exp(0.26x) (r = 0.72), and y = 2.66 + 4.23exp(0.28x) (r = 0.66) for the control and 7, 15 and 30 days post-injury groups, respectively. D, cumulative sum histograms of the recruitment thresholds obtained in control and at 7 days after crushing. Histograms were fitted by exponential growing functions (P < 0.0001) with equations y = 0.01 + 0.53exp(0.16x) (r = 0.98) and y =−0.08 + 0.76exp(0.07x) (r = 0.99) for the control and experimental data, respectively. E, graph showing the recruitment gain (as the line slopes) between 0 and 5% of ETCO2 for the neuronal pools illustrated in D. Linearization was obtained following semilogarithmic transformation of the ordinate axis scale. F, total spike activity (in arbitrary units) in the control and experimental hypoglossal nuclei (HNs). Motor output for each group was estimated as the product of the exponential curves in D (cumulative frequency of recruited units) times the cumulative mean SmFR in steps of 0.1%ETCO2 variations. For comparison, data were expressed relative to maximum output activity in the control situation.
Figure 9
Figure 9. Effects of XIIth nerve crushing on synaptic density in the hypoglossal nucleus
AD, photomicrographs obtained from coronal sections at different rostrocaudal levels in animals at 1 and 15 days post-lesion. In each section, the experimental side (crushed) was compared with the control side. E and F, high magnification photomicrographs showing neurones (n) surrounded by punctate-like synaptophysin immunoreactivity in the control (E) and crushed (F) sides, obtained 15 days after crushing. G, photomicrograph obtained from a coronal section of an animal 15 days post-lesion at a rostrocaudal level similar to that shown in A and C, in which primary antibody was omitted. Calibration bars: A–D and G, 250 μm; E and F, 25 μm.
Figure 10
Figure 10. Quantitative effects of XIIth nerve crushing on synaptic density in the hypoglossal nucleus
Decrease of the optical density (O.D) in the experimental side compared to control side at the indicated time points after crushing. Values are means ± s.e.m. from 3 animals. *Significant differences (P < 0.05, non-parametric Mann-Whitney U test) relative to measurements obtained at 1 day post-lesion.

Similar articles

Cited by

References

    1. Al-Majed AA, Neumann CM, Brushart TM, Gordon T. Brief electrical stimulation promotes the speed and accuracy of motor axonal regeneration. J Neurosci. 2000;20:2602–2608. - PMC - PubMed
    1. Brännström T, Kellerth JO. Changes in synaptology of adult cat spinal α-motoneurons after axotomy. Exp Brain Res. 1998;118:1–13. - PubMed
    1. Brushart TM, Hoffman PN, Royall RM, Murinson BB, Witzel C, Gordon T. Electrical stimulation promotes motoneuron regeneration without increasing its speed or conditioning the neuron. J Neurosci. 2002;22:6631–6638. - PMC - PubMed
    1. Chen R, Cohen LG, Hallett M. Nervous system reorganization following injury. Neuroscience. 2002;111:761–773. - PubMed
    1. Cohen MI. Discharge patterns of brain-stem respiratory neurons in relation to carbon dioxide tension. J Neurophysiol. 1968;31:142–165. - PubMed

Publication types

LinkOut - more resources