Comparative Study
. 2004 Apr 22;42(2):269-81.
doi: 10.1016/s0896-6273(04)00159-x.

Activator of G protein signaling 3: a gatekeeper of cocaine sensitization and drug seeking

Affiliations
Comparative Study

Activator of G protein signaling 3: a gatekeeper of cocaine sensitization and drug seeking

M Scott Bowers et al. Neuron. .

Abstract

Chronic cocaine administration reduces G protein signaling efficacy. Here, we report that the expression of AGS3, which binds to GialphaGDP and inhibits GDP dissociation, was upregulated in the prefrontal cortex (PFC) during late withdrawal from repeated cocaine administration. Increased AGS3 was mimicked in the PFC of drug-naive rats by microinjecting a peptide containing the Gialpha binding domain (GPR) of AGS3 fused to the cell permeability domain of HIV-Tat. Infusion of Tat-GPR mimicked the phenotype of chronic cocaine-treated rats by manifesting sensitized locomotor behavior and drug seeking and by increasing glutamate transmission in nucleus accumbens. By preventing cocaine withdrawal-induced AGS3 expression with antisense oligonucleotides, signaling through Gialpha was normalized, and both cocaine-induced relapse to drug seeking and locomotor sensitization were prevented. When antisense oligonucleotide infusion was discontinued, drug seeking and sensitization were restored. It is proposed that AGS3 gates the expression of cocaine-induced plasticity by regulating G protein signaling in the PFC.


Figures

Figure 1
Figure 1
AGS3 was upregulated during withdrawal from repeated cocaine administration. (A and B) After 3 and 8 weeks of withdrawal, AGS3 was upregulated in the prefrontal cortex (PFC) and nucleus accumbens core (NAcore), but not in the shell of the nucleus accumbens (NAshell), dorsal striatum (STR), or the ventral tegmental area (VTA). (C) AGS3 was elevated in the PFC at 3 weeks after discontinuing cocaine self-administration compared with yoked saline control subjects. Representative blots of AGS3 (panels A and C) are shown as well as blots probed for calnexin, an integral membrane protein of the endoplasmic reticulum, to demonstrate even loading across the gel. Odd numbers = repeated saline group; even numbers = repeated cocaine group. Data were normalized to percent change from saline control values within each blot. * P < 0.05, comparing withdrawal from repeated saline to withdrawal from repeated cocaine using a 2-tailed, unpaired Student’s t-test.
Figure 2
Figure 2
Tat-GPR prevents Giα signaling. (A) [35S]GTPγS binding to 100 nM purified Giα was blocked by increasing concentrations of Tat-GPR (100 μM) while Tat-mGPR (100 μM) was ineffective. (B) High affinity (4 nM [3H]-UK14304) binding in DDT1-MF2 membranes stably expressing the α2A/D adrenergic receptor was inhibited by Tat-GPR, but not by Tat-mGPR. N.S. – non-specific binding; GppNHp – guanyly imidodiphosphate is a nonhydrolyzable form of GTP that produced maximal reduction in [3H]-UK14304 binding. Data depict mean ± s.e.m., n = 2 – 5, run in duplicate. * P < 0.01, using 2-tailed, unpaired Student’s t-test comparing Tat-GPR with Tat-mGPR
Figure 3
Figure 3
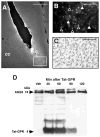
Tat-peptides were efficiently transduced and exhibited no apparent toxicity. (A) Epifluorescent micrograph illustrates Tat-fluorescein containing cells at the tip of the microinjection cannulae 30 minutes after microinjection. Cannulae placements are within area Cg3 (Paxinos and Watson, 1998) near the prelimbic/infralimbic border of the PFC. Bar = 1 mm, cc – corpus callosum. (B) Tat- fluorescein fills the cell bodies of pyramidal neurons and extends into the dendrites (white triangle). Astroglia were also transduced (black triangle). bar = 100 μm, cc – corpus callosum. (C) Nissl staining revealed an abundance of healthy appearing neurons at the infusion site. (D) A pan GPR antibody illustrates that after microinjection into the PFC, Tat-GPR (4 kDa) is cleared within 120 minutes. Cross-reactivity of the GPR antibody to AGS3 (74 kDa) demonstrated even gel loading. Veh- vehicle administration
Figure 4
Figure 4
Tat-GPR in the PFC produces a sensitization-like behavioral and neurochemical phenotype. (A and B) Microinjection of Tat-GPR into the PFC produced a sensitized motor response to cocaine (15 mg/kg, ip) in drug-naïve subjects. Animals were habituated to the test chamber (time= −60 – 0), microinjected with either Tat-GPR or Tat-mGPR (time =0), and injected with cocaine or saline (time = 30). Data points depict mean distance traveled or number of stereotypies ± s.e.m., n = 8. (C) Microinjection of Tat-GPR into the PFC augmented the reinstatement of drug-seeking (active lever pressing) by a cocaine priming injection (5 mg/kg, ip). Two reinstatement trials were conducted in animals extinguished to criterion (Ext I; Ext II) and Tat-GPR or Tat-mGPR were administered 30 min prior to the cocaine priming injection in random order. Data are shown as mean ± sem active lever presses, n = 9. Ext- number of active lever presses on the day of extinction training prior to the reinstatement trial. (D) Cocaine-induced (15 mg/kg, ip) increase in extracellular glutamate in the accumbens core was augmented by pretreatment of the PFC with Tat-GPR. Data points depict mean ± s.e.m. pmol/dialysis sample, n = 8. Tat-peptide – either Tat-GPR or Tat-mGPR. Challenge = either cocaine (15 mg/kg, ip) or saline (1 ml/kg, ip). * P < 0.05, using a 2-way ANOVA with repeated measures over time using a least significant difference test for post-hoc comparisons of Tat-GPR to TAT-mGPR (panels A, B, D) or a two-tailed paired Student’s t-test (panel C).
Figure 5
Figure 5
Regulating AGS3 expression with antisense oligonucleotides. (A) AGS3 was downregulated following either 1 or 2 weeks continuous infusion of antisense into the PFC and returned 2 weeks after antisense infusion was terminated. (B) Animals were injected with daily saline or cocaine for one week, oligonucleotide was bilaterally infused for 2 weeks, pumps removed and two weeks later levels of AGS3 in PFC measured. AS-1 – antisense flanking the AGS3 initiation codon; Sc – a scrambled form of AS-1 that does not bind any known gene; AS-2 – antisense directed entirely within the AGS3 open reading frame. Data points are depicted as mean ± sem percent change in optical density from scrambled (A) or chronic saline + scrambled (B). n is indicated in each bar. * P < 0.05, comparing AS-1 or AS-2 with SC using a 2-tailed, paired Student’s t-test. # P < 0.05, comparing chronic saline with chronic cocaine; a 2-way ANOVA revealed a significant effect of chronic treatment, but no effect of oligonucleotide or interaction between chronic drug and oligonucleotide.
Figure 6
Figure 6
Lack of neurotoxicity after 2 weeks of oligonucleotide infusion into the PFC. (A, D, and G) Cannulae placements were near the prelimbic/infralimbic border of the PFC (Paxinos and Watson, 1998). bar = 1 mm, cc – corpus callosum. (B, E, and H) Visual inspection of Nissl staining for chromatolysis and microglial reactivity directly below the infusion site revealed an abundance of healthy appearing neurons. (C, F, and I) No difference was detected between treatments when glial fibrillary acidic protein (GFAP) immunoreactivity was utilized to assess activated or proliferating astroglia. Increased GFAP expression was apparent after all oligonucleotides within 100 μm of the indwelling cannula. Bar = 100 μm.
Figure 7
Figure 7
Elevation of AGS3 parallels decreased signaling through Giα coupled receptors. (A) 3 weeks withdrawal from one week of daily cocaine administration decreased (−)-quinpirole stimulated Giα signaling at D2/3 receptors in the PFC. This effect was reversed by AS-1. Representative immunoblot showing lack of effect of AS-1 on D2 levels in PFC. (B) APDC stimulation of mGluR2/3 receptors and representative immunoblot of mGluR2/3 monomer and dimer. The AS-1 + Sal group was not examined. (C) Signaling through Gsα coupled D1 dopamine receptors was equivalent for all treatment groups. Data in each panel are shown as mean ± s.e.m. and were analyzed using a 3-way ANOVA with repeated measures over drug concentration. For mGluR2/3 and D2/3 receptors there was a significant effect of nucleotide and drug concentration, but no interaction between oligonucleotide and concentration. No significant effect of factor or interaction between factors was found for D1 receptors. Sc- scrambled, Coc-repeated cocaine, Sal- repeated saline. * P < 0.01, comparing Sc + Coc with all other treatment groups using post hoc 3-way repeated measures ANOVAs over drug concentration.
Figure 8
Figure 8
Reduction of AGS3 in the PFC by antisense oligonucleotide inhibits locomotor sensitization. (A) Timeline summarizing the behavioral protocol. (B) The cumulative motor response to the cocaine at days 1, 28 and 42. (C) The motor response to cocaine injection on day 28 in the presence of oligonucleotide. (D) The motor response to cocaine on day 42 two weeks after removing the osmotic minipumps delivering oligonucleotide into the PFC. (E) Two weeks of oligonucleotide infusion did not affect the drug-naïve animals to a novel environment (open-field photocell chamber), or an injection of saline (1ml/kg, ip) or cocaine (15 mg/kg, ip). The data are shown as cumulative distance traveled over 60 min after injection or exposure to a novel environment. n= 8 in all treatment groups. Data in (B, C and D) were analyzed together using a 3-way ANOVA with repeated measures over time. A significant effect was found over treatment and time, as well as a significant 3 way interaction between treatment, oligonucleotide and time. Data in (E) were analyzed using an unpaired Student’s t-test and no differences were found. * P < 0.05, using a least significant difference test for post-hoc comparisons between AS-1 and scrambled on day 28. + P < 0.05, comparing day 28 with day 42 in the AS-1 group # P < 0.05, comparing day 28 with day 1 in the AS-1 group
Figure 9
Figure 9
Prefrontal cortical AGS3 regulates cocaine-seeking behavior. (A) Timeline outlining the experimental protocol. (B) Oligonucleotide infusion did not impair food seeking. (C) Bilaterally reducing AGS3 blocked the reinstatement of drug-seeking behavior while infusion with scrambled oligonucleotide had no effect. (D) Reinstatement of drug seeking was initiated by a cocaine injection 2 weeks after discontinuing oligonucleotide infusion in all groups. Data points depict mean active lever presses ± s.e.m., n = 8 in all groups. Ext – total active lever presses made during the extinction trial the day prior to the cocaine-induced reinstatement trial; Test – total active lever presses made during cocaine reinstatement; Retest - total active lever presses following a second extinction period and a second cocaine reinstatement; Sc = scrambled oligonucleotide * P < 0.05, using 2-way ANOVA with repeated measures over time using a least significant difference test for post-hoc comparisons.

Comment in

References

    1. Altschul SF, Boguski MS, Gish W, Wootton JC. Issues in searching molecular sequence databases. Nat Genet. 1994;6:119–129. - PubMed
    1. Anderson SW, Bechara A, Damasio H, Tranel D, Damasio AR. Impairment of social and moral behavior related to early damage in human prefrontal cortex. Nat Neurosci. 1999;2:1032–1037. - PubMed
    1. Baker DA, McFarland K, Lake RW, Shen H, Tang XC, Toda S, Kalivas PW. Neuroadaptations in cystine-glutamate exchange underlie cocaine relapse. Nat Neurosci. 2003;6:743–749. - PubMed
    1. Berke JD, Hyman SE. Addiction, dopamine, and the molecular mechanisms of memory. Neuron. 2000;25:515–532. - PubMed
    1. Bernard ML, Peterson YK, Chung P, Jourdan J, Lanier SM. Selective interaction of AGS3 with G-proteins and the influence of AGS3 on the activation state of G-proteins. J Biol Chem. 2001;276:1585–1593. - PubMed

Publication types

MeSH terms