. 2004 Jul 2;279(27):28345-57.
doi: 10.1074/jbc.M400457200. Epub 2004 Apr 19.

The hepatitis E virus open reading frame 3 protein activates ERK through binding and inhibition of the MAPK phosphatase

Affiliations

The hepatitis E virus open reading frame 3 protein activates ERK through binding and inhibition of the MAPK phosphatase

Anindita Kar-Roy et al. J Biol Chem. .

Abstract

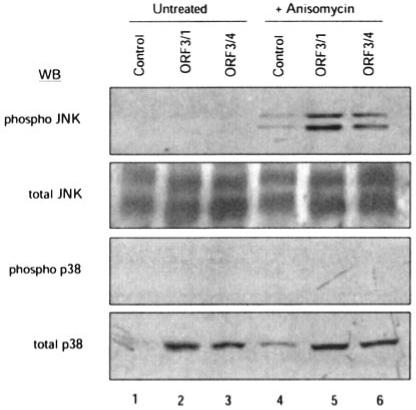
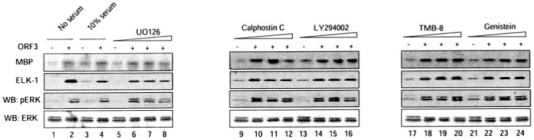
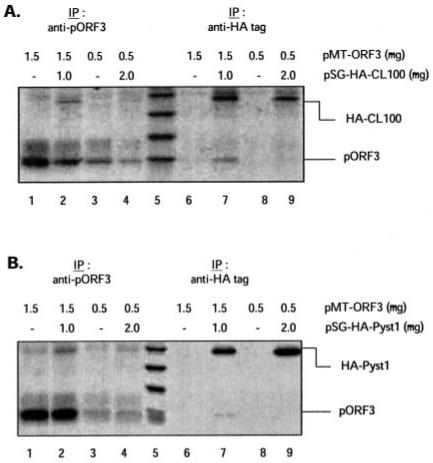
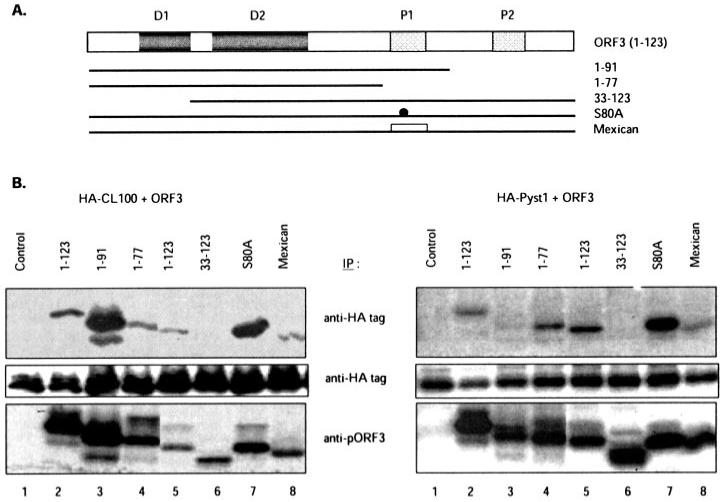
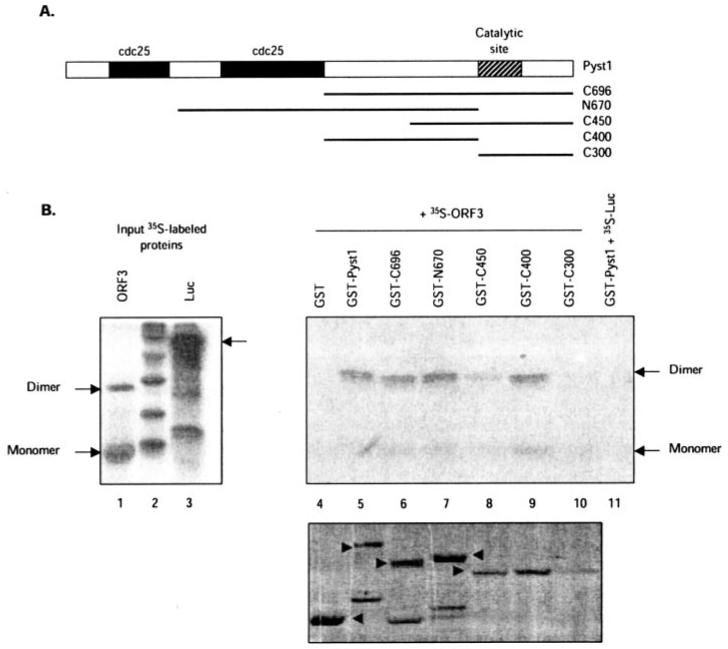
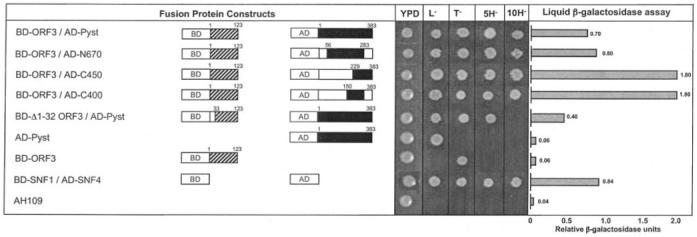
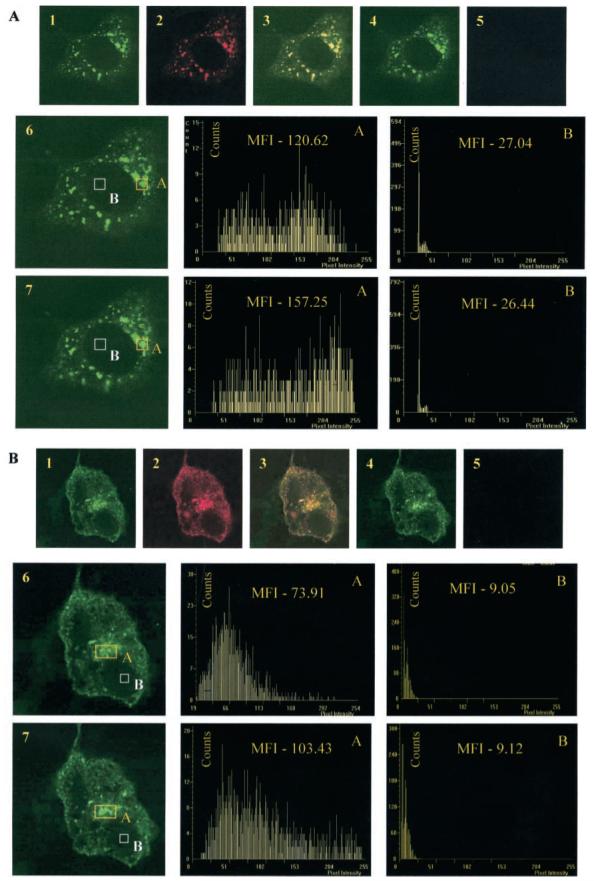
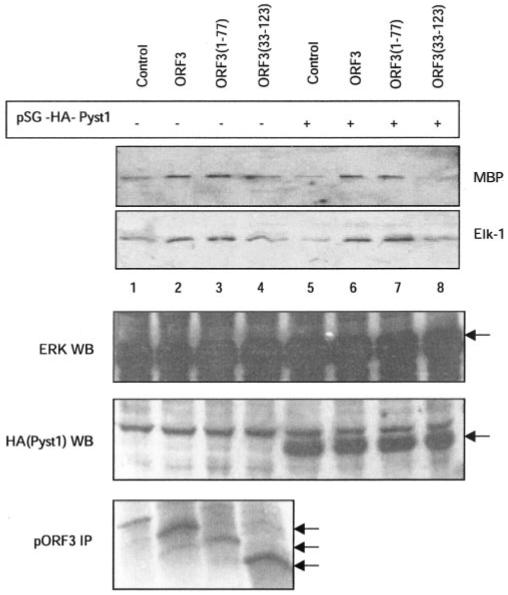
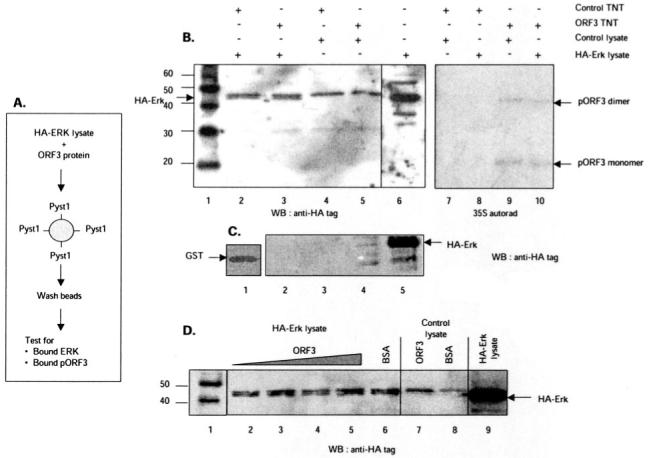
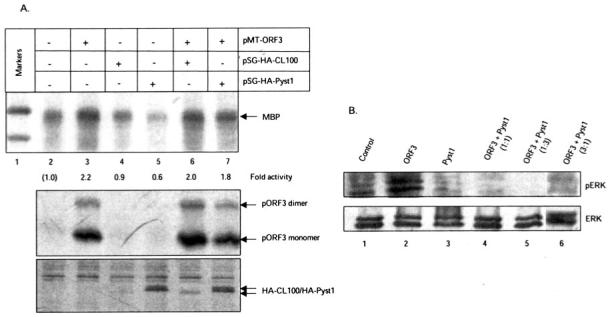
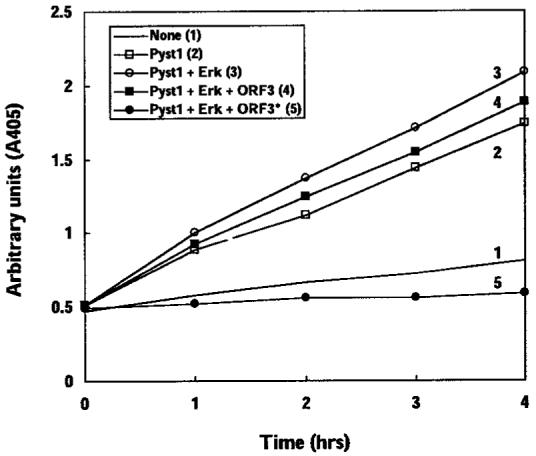
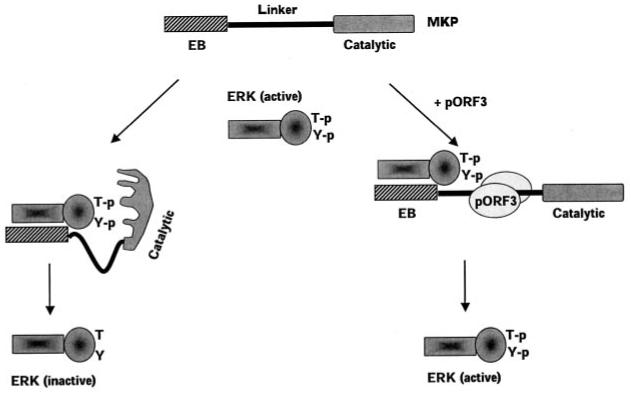
The hepatitis E virus causes acute viral hepatitis endemic in much of the developing world and is a serious public health problem. However, due to the lack of an in vitro culture system or a small animal model, its biology and pathogenesis are poorly understood. We have shown earlier that the ORF3 protein (pORF3) of hepatitis E virus activates ERK, a member of the MAPK superfamily. Here we have explored the mechanism of pORF3-mediated ERK activation and demonstrated it to be independent of the Raf/MEK pathway. Using biochemical assays, yeast two-hybrid analysis, and intracellular fluorescence resonance energy transfer we showed that pORF3 binds Pyst1, a prototypic member of the ERK-specific MAPK phosphatase. The binding regions in the two proteins were mapped to the N terminus of pORF3 and a central portion of Pyst1. Expression of pORF3 protected ERK from the inhibitory effects of ectopically expressed Pyst1. This is the first example of a viral protein regulating ERK activation by inhibition of its cognate dual specificity phosphatase.


Figures

Fig. 1
Fig. 1. Effect of pORF3 on JNK and p38 MAPKs
Two independent cell lines stably expressing pORF3 (ORF3/1 and ORF3/4) or a control cell line were either left untreated (lanes 1-3) or treated with 10 μg/ml anisomycin for 60 min (lanes 4-6). The cell lysates were subjected to Western blotting (WB) with the indicated antibodies.
Fig. 2
Fig. 2. Effect of various pathway inhibitors on pORF3-mediated ERK activation
Cells stably expressing pORF3 or a control cell line were serum-starved and then treated with either 10% serum (lanes 3 and 4) or with one of the inhibitors indicated (lanes 5-24). Cell growth and treatments were as described under “Experimental Procedures.” For each set, the control cells were treated with an IC50 concentration of the inhibitor; the pORF3-expressing cells were treated with IC50, 2× IC50, or 5× IC50 concentrations of the inhibitor. Cell lysates were tested for ERK activity using MBP and Elk-1 as substrates as described under “Experimental Procedures.” The lysates were also Western blotted (WB) with anti-phospho-ERK and total ERK antibodies. Each blot was individually scanned, and the bands were quantitated by densitometry using Kodak 1D image analysis software (Kodak Digital Science).
Fig. 3
Fig. 3. Binding of pORF3 to MAPK phosphatases
COS-1 cells were transiently transfected with the indicated amounts of plasmid pMT-ORF3 alone or together with either pSG-CL100 (A) or pSG-Pyst1 (B). The cells were metabolically labeled with [35S]methionine-cysteine, and the cell lysates were immunoprecipitated (IP) with antibodies to either pORF3 (lanes 1-4) or the HA tag (lanes 6-9) as described under “Experimental Procedures.” The immunoprecipitates were resolved by SDS-15% PAGE, and the proteins were detected by fluorography.
Fig. 4
Fig. 4. Mapping of the interaction domain on pORF3
A, the ORF3 protein and its mutants used in this study are illustrated. The two N-terminal hydrophobic domains (D1 and D2) and two C-terminal proline-rich regions (P1 and P2) are shown. The S80A mutant contains a site-directed Ser to Ala mutation at amino acid residue 80 in pORF3. The Mexican mutant expresses an ORF3 protein with a divergent P1 region and that lacks the Ser-80 residue. B, COS-1 cells were transfected with pSG-HA-CL100 (left panels) or pSG-HA-Pyst1 (right panels) together with either the control vector pMT3 (lane 1) or the same vector expressing wild type or mutant pORF3 as indicated (lanes 2-8). Cells were transfected with plasmids expressing either His6-tagged (lanes 2-4) or untagged (lanes 5-8) versions of the wild type or mutant pORF3, metabolically labeled, and immunoprecipitated (IP) with either anti-HA tag (top and middle panels) or anti-pORF3 (bottom panels). The panels show wild type or mutant pORF3 (top and bottom) or HA-CL100 or HA-Pyst1 (middle).
Fig. 5
Fig. 5. Mapping of the interaction domain on Pyst1
A, the Pyst1 protein and its mutants used in this study are illustrated. The two N-terminal Cdc25 homology domains and the C-terminal catalytic site are shown. B, GST pull-down assay for pORF3-Pyst1 interaction. The ORF3 protein (lane 1) or a control luciferase protein (lane 3) were expressed and labeled with [35S]methionine-cysteine in a coupled in vitro transcription-translation reaction. The labeled proteins were then incubated with glutathione-Sepharose beads containing equivalent amounts of GST-fused full-length (lane 5) or mutant Pyst1 (lanes 6-10) proteins, and the retained pORF3 was analyzed as described under “Experimental Procedures.” As controls, pORF3 retained on GST beads (lane 4) or 35S-labeled luciferase (Luc) retained on GST-Pyst1 beads (lane 11) was also analyzed. The pORF3 monomer and dimer are indicated. The bottom panel shows GST and GST-Pyst1 fusion proteins (arrowheads) used for the pull-down.
Fig. 6
Fig. 6. Yeast two-hybrid analysis
The Gal4 DNA-binding domain (BD) and activation domain (AD) were cloned in-frame with either full-length or mutant ORF3 (hatched boxes) or full-length or mutant Pyst1 (solid boxes). Open boxes indicate regions that were deleted from the wild type sequences of both ORF3 and Pyst1. The numbers above the boxes represent the first and last amino acids of the regions included. L and T represent growth on SDLeu or SDTrp plates, respectively, where SD is synthetic dextrose, composed of 0.67% yeast nitrogen base without amino acids, 2% dextrose, amino acids, and uracil. 5H and 10H represent growth on SDLeuTrpHis plates containing 5 or 10 mm 3-aminotriazole, respectively. The liquid β-galactosidase assay results are shown for the transformants.
Fig. 7
Fig. 7. FRET analysis of protein-protein interactions
A, homodimerization of the ORF3 protein. COS-1 cells were cotransfected with pECFP-ORF3 and pEYFP-ORF3 and imaged for ECFP (pseudocolored green) or EYFP (pseudocolored red) before (panels 1 and 2) and after (panels 4 and 5) EYFP photobleaching. Panel 3 shows a merge of panels 1 and 2. Histograms of the mean fluorescence intensity (MFI) of ECFP in the area of colocalization (A) and in the region where the two proteins do not colocalize (B) are shown either before (panel 6) or after (panel 7) photobleaching of EYFP. B, interaction between the ORF3 and Pyst1 proteins. COS-1 cells were cotransfected with pECFP-ORF3 and pEYFP-Pyst1 and imaged for ECFP and EYFP as above. Mean fluorescence intensities were determined as described under “Experimental Procedures.” Representative images are shown.
Fig. 8
Fig. 8. ERK activation by mutant ORF3 proteins
Cells were transfected with expression vectors for wild type (lanes 2 and 6) or mutant (lanes 3, 4, 7, and 8) ORF3 proteins in the absence (lanes 1-4) or presence (lanes 5-8) of plasmid pSG-HA-Pyst1. Empty pMT3 vector was used as control (lanes 1 and 5). Cell lysates were prepared and assayed for ERK activity using either MBP or Elk-1 as a substrate as described under “Experimental Procedures.” The lower panels show Western blots (WB) for expression of ERK and Pyst1 (anti-HA tag) and immunoprecipitation (IP) for full-length and deleted pORF3. Arrows indicate the relevant protein bands.
Fig. 9
Fig. 9. Competition between ERK and pORF3 for binding Pyst1
A, schematic representation showing the experimental strategy. Lysates from cells expressing HA-tagged ERK were mixed with pORF3, and the mixture was incubated with either GST-tagged Pyst1 or GST alone bound to glutathione-Sepharose beads. After washing, the amounts of ERK and pORF3 trapped on the beads were estimated. B, either control (lanes 2, 4, 7, and 8) or ORF3-expressing (lanes 3, 5, 9, and 10) in vitro transcription-translation (TnT) lysates were mixed with lysates from control (lanes 4, 5, 7, and 9) or HA-ERK-expressing (lanes 2, 3, 8, and 10) cells. The TnT reactions were labeled with [35S]methionine. The ERK retained on beads was estimated by Western blotting (WB) with anti-HA tag antibodies (lanes 1-6); the retained pORF3 was estimated by autoradiography (lanes 7-10). Lane 1 shows molecular size markers (kilodaltons), and lane 6 shows HA-ERK expression in the cell lysates. Arrows indicate HA-ERK (lower band in the doublet) and the pORF3 monomer or dimer. C, lysates from control (lane 2) or HA-ERK-expressing (lane 3) cells were incubated with GST beads. After washing, the beads were Western blotted with anti-HA tag antibodies. Lane 1 shows GST loading on beads, while lanes 4 and 5 show direct Western blotting of control or HA-ERK cell lysates, respectively, with anti-HA antibodies. D, lysates from HA-ERK-expressing cells (lanes 2-6) were mixed with 6, 10, 15, or 20 μg of purified recombinant pORF3 (lanes 2-5) or 20 μg of BSA (lane 6). Lysates from control cells were mixed with 20 μg of either pORF3 (lane 7) or BSA (lane 8). Following incubation with beads and washing, the retained HA-ERK was estimated by Western blotting. Lane 1 shows molecular size markers (kilodaltons), and lane 9 shows HA-ERK expression in the cell lysates.
Fig. 10
Fig. 10. Protection of ERK activity by pORF3
A, cells were transfected with the indicated plasmids, and the endogenous ERK activity present in cell lysates was determined using the MBP assay. The -fold activity was calculated by densitometric scanning of the bands; the ERK activity present in mock-transfected cells (lane 2) was used as a reference. The lower panels show Western blots for expression of pORF3 and HA-tagged CL100 or Pyst1. Arrows indicate the relevant protein bands. B, cell lysates were Western blotted for cellular ERK with anti-phospho-ERK (pERK) or anti-ERK antibodies.
Fig. 11
Fig. 11. Inhibition of MKP by pORF3
Cells were transfected with expression vectors for ORF3, Pyst1, or mixtures of the two in the indicated ratios. Cell lysates (2 μg of protein each) were assayed for phosphatase activity in the presence of either exogenously added purified recombinant pORF3 (line 5) or an equivalent amount of BSA (lines 1-4) as described under “Experimental Procedures.” The values represent an average of triplicate measurements from one of two separate experiments.
Fig. 12
Fig. 12. Model for pORF3-mediated ERK activation
Binding of ERK to the EB domain of MKP-3 leads to a conformational change in the latter bringing its catalytic domain in close proximity to the phosphothreonine (T-p) and phosphotyrosine (Y-p) residues in activated ERK. This leads to dephosphorylation and inactivation of ERK. The ORF3 protein binds the linker region of MKP-3 (possibly as a dimer) and prevents the conformational change required for its activation following ERK binding to the EB domain. This results in catalytically inefficient MKP-3 and higher levels of active ERK.

References

    1. Purcell RH, Ticehurst JR. In: Viral Hepatitis and Liver Disease. Zuckerman AJ, editor. New York: Alan R. Liss; 1988. pp. 131–137.
    1. Ramalingaswami V, Purcell RH. Lancet. 1988;1:571–573. - PubMed
    1. Krawczynski K. Hepatology. 1993;17:932–941. - PubMed
    1. Panda SK, Jameel S. Viral Hepatitis Rev. 1997;3:227–251.
    1. Purcell RH, Emerson SU. In: Fields Virology. 4th Ed. Knipe DM, Howley PM, editors. Philadelphia: Lippincott Williams and Wilkins; 2001. pp. 3051–3061.

Publication types

MeSH terms

Substances