. 2004 Apr 27;101(17):6445-9.
doi: 10.1073/pnas.0401314101. Epub 2004 Apr 19.

Stochastic model of protein-protein interaction: why signaling proteins need to be colocalized

Affiliations

Stochastic model of protein-protein interaction: why signaling proteins need to be colocalized

Nizar N Batada et al. Proc Natl Acad Sci U S A. .

Abstract

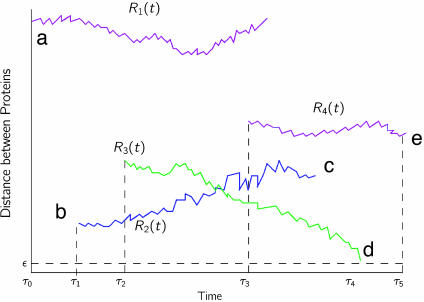
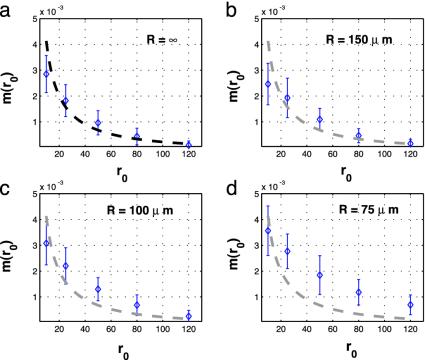
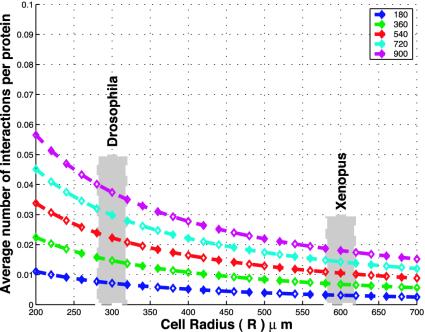
Colocalization of proteins that are part of the same signal transduction pathway via compartmentalization, scaffold, or anchor proteins is an essential aspect of the signal transduction system in eukaryotic cells. If interaction must occur via free diffusion, then the spatial separation between the sources of the two interacting proteins and their degradation rates become primary determinants of the time required for interaction. To understand the role of such colocalization, we create a mathematical model of the diffusion based protein-protein interaction process. We assume that mRNAs, which serve as the sources of these proteins, are located at different positions in the cytoplasm. For large cells such as Drosophila oocytes we show that if the source mRNAs were at random locations in the cell rather than colocalized, the average rate of interactions would be extremely small, which suggests that localization is needed to facilitate protein interactions and not just to prevent cross-talk between different signaling modules.


Figures

Fig. 1.
Fig. 1.
Model of protein interactions. Proteins are of two types: I and II. Protein of type I is translated from mRNA at rate β1, and that of type II is translated at rate β2. Protein of type I is degraded at rate δ1 and that of type II is degraded at rate δ2. The product of degradation is denoted by empty braces. As soon as a protein is made, it diffuses according to a three-dimensional Brownian process. If paths of interacting proteins come within distance ε of each other, then these proteins are considered to have interacted (ε is about a protein diameter).
Fig. 2.
Fig. 2.
Illustration of the Bessel process that represents the three-dimensional problem of protein location as a one-dimensional problem of distance process. This figure describes events that can occur in the lifetime of a protein of type I that can interact only with another protein of type II. a, Protein P of type I is born at some time, τ0. As soon as it is born, it finds that there are certain proteins of type II that are alive. The time evolution of the distance is represented by R1(t). b, At time τ1, a protein of type II is born. Notice that distance r0, which is the initial distance between this newly born protein of type II and P, varies as P undergoes Brownian motion. Again, the time evolution of the distance between protein P and the protein of type II born at τ1 is represented by R2(t). c, Before this protein gets a chance to come close enough to P, it gets degraded. d, Protein of type II born at time τ2 is able to interact with P. Formally, we say that the Bessel process R3(t) is absorbed at ε. e, Protein of type II born at τ3 does not get enough time to interact with protein P, because P is degraded at time τ5.
Fig. 3.
Fig. 3.
The average rate of interactions as a function of distance between mRNAs. Thirty-five simulations were performed for each separation, with a protein synthesis rate of one per 3.5 min, a protein half-life of 15 min, and a diffusion coefficient of 1 μm2/s for both types. An interaction distance of 100 Å was used. (a) No boundary case. (b) Spherical cell with radius 150 μm. (c) Spherical cell with a radius of 100 μm. (d) Spherical cell with a radius of 75 μm. The error bars are at mean ±1 standard deviation. Heavy dashed lines represent the predicted value from Eq. 4, which assumes no cell boundary.
Fig. 4.
Fig. 4.
Expected rate of interactions over all possible separations of mRNA sources as a function of half-life. The following parameters were used in Eq. 5: a protein synthesis rate (β1 and β2) of one per 2 min, number of mRNAs of type I and II (n1 and n2) of four each, a diffusion coefficient (D) of 10-8 cm2/s for both types, an interaction distance (ε) of 100 Å, and five values of half-life (δ), which are shown in the legend in minutes.

References

    1. Scott, J. D. & Pawson, T. (2000) Sci. Am. 282 (6), 72-79. - PubMed
    1. Holstege, F. C., Jennings, E. G., Wyrick, J. J., Lee, T. I., Hengartner, C. J., Green, M. R., Golub, T. R., Lander, E. S. & Young, R. A. (1998) Cell 95, 717-728. - PubMed
    1. Velculescu, V. E., Madden, S. L., Zhang, L., Lash, A. E., Yu, J., Rago, C., Lal, A., Wang, C. J., Beaudry, G. A., Ciriello, K. M., et al. (1999) Nat. Genet. 23, 387-388. - PubMed
    1. Blake, W. J., Ern, M. K. A., Cantor, C. R. & Collins, J. J. (2003) Nature 422, 633-637. - PubMed
    1. Varshavsky, A. (1996) Proc. Natl. Acad. Sci. USA 93, 12142-12149. - PMC - PubMed

Publication types