

Single-molecule high-resolution imaging with photobleaching
- PMID: 15096603
- PMCID: PMC404067
- DOI: 10.1073/pnas.0401638101
Single-molecule high-resolution imaging with photobleaching
Abstract
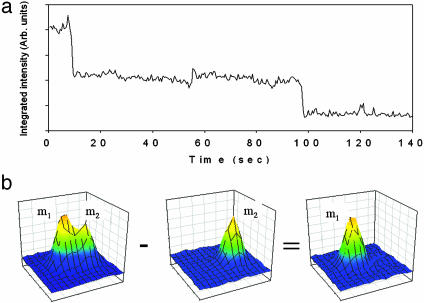
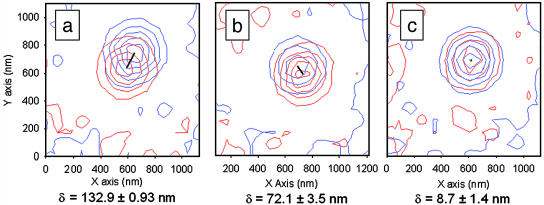
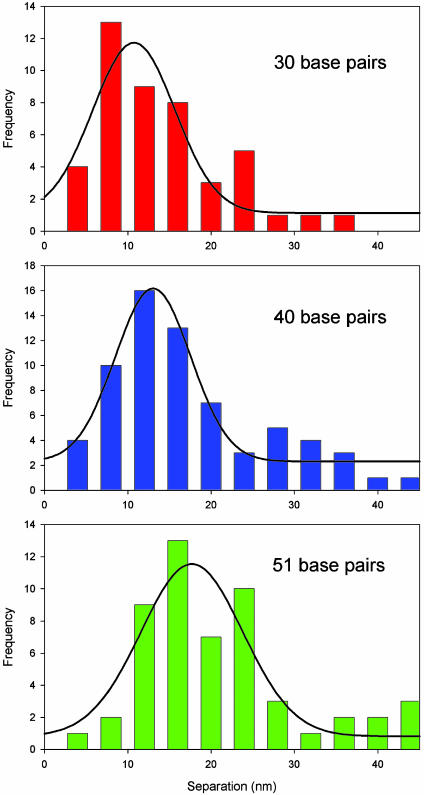
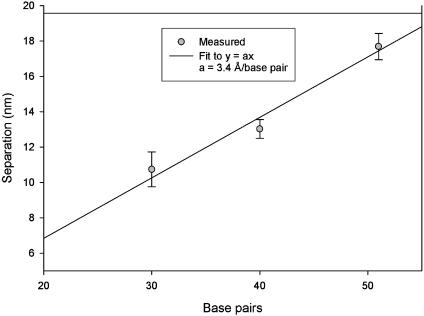
Conventional light microscopy is limited in its resolving power by the Rayleigh limit to length scales on the order of 200 nm. On the other hand, spectroscopic techniques such as fluorescence resonance energy transfer cannot be used to measure distances >10 nm, leaving a "gap" in the ability of optical techniques to measure distances on the 10- to 100-nm scale. We have previously demonstrated the ability to localize single dye molecules to a precision of 1.5 nm with subsecond time resolution. Here we locate the position of two dyes and determine their separation with 5-nm precision, using the quantal photobleaching behavior of single fluorescent dye molecules. By fitting images both before and after photobleaching of one of the dyes, we may localize both dyes simultaneously and compute their separation. Hence, we have circumvented the Rayleigh limit and achieved nanometer-scale resolution. Specifically, we demonstrate the technique by measuring the distance between single fluorophores separated by 10-20 nm via attachment to the ends of double-stranded DNA molecules immobilized on a surface. In addition to bridging the gap in optical resolution, this technique may be useful for biophysical or genomic applications, including the generation of super-high-density maps of single-nucleotide polymorphisms.
Figures
References
-
- Weiss, S. (1999) Science 283, 1676-1683. - PubMed
-
- Strutt, J. W. (1874) Philos. Mag. 47, 81-93, 193–205.
-
- Dyba, M. & Hell, S. W. (2002) Phys. Rev. Lett. 88, 163901-163904. - PubMed
-
- van Oijen, A. M., Köhler, J., Schmidt, J., Müller, M. & Brakenhoff, G. J. (1999) J. Opt. Soc. Am. A 16, 909-915.
-
- Selvin, P. R. (2000) Nat. Struct. Biol. 7, 730-734. - PubMed
Publication types
MeSH terms
Substances
Grants and funding
LinkOut - more resources
Full Text Sources
Other Literature Sources
Miscellaneous
