Comparative Study
. 2004 Apr 28;126(16):5130-7.
doi: 10.1021/ja031504a.

Informational complexity and functional activity of RNA structures

Affiliations
Comparative Study

Informational complexity and functional activity of RNA structures

James M Carothers et al. J Am Chem Soc. .

Abstract

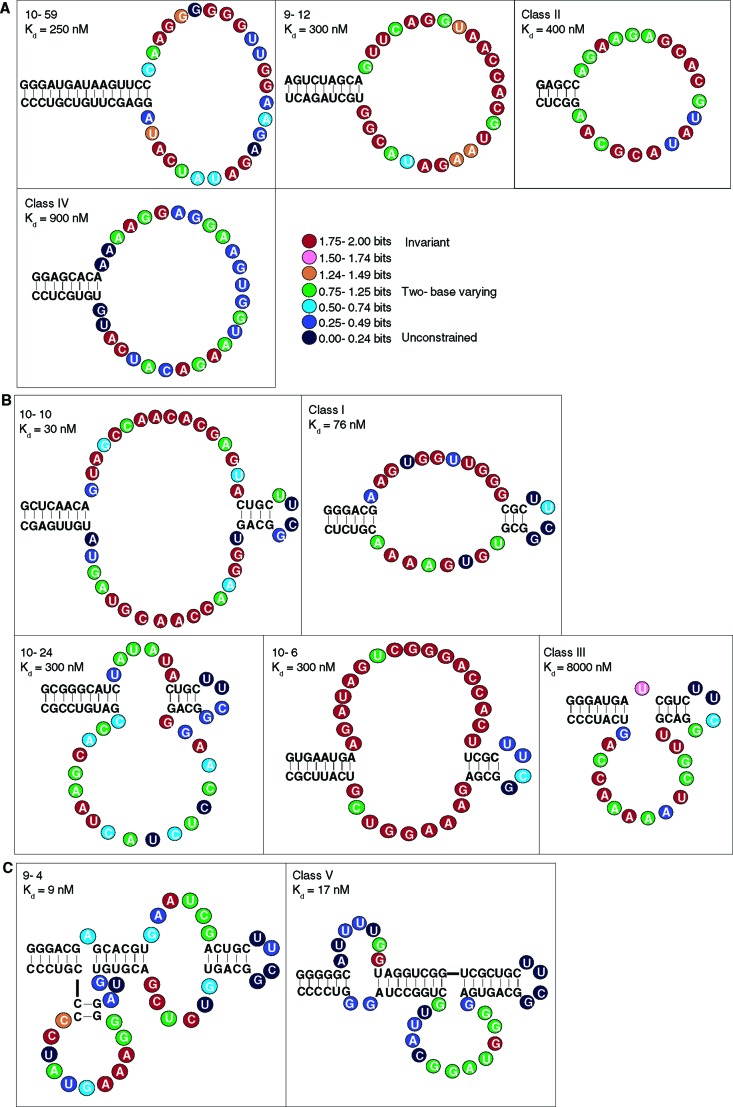
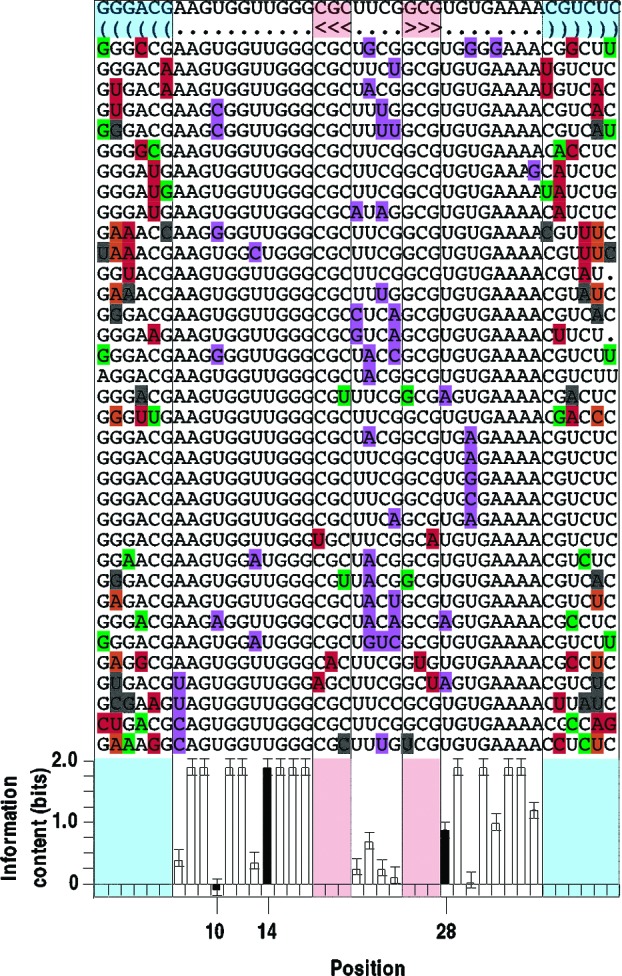
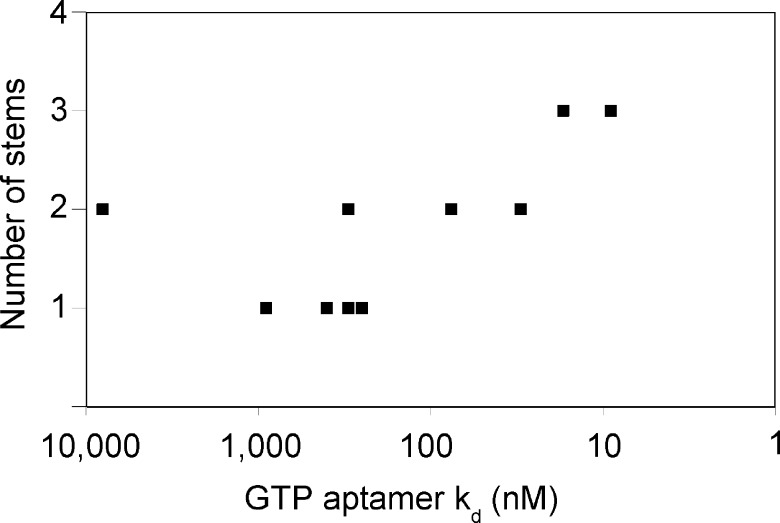
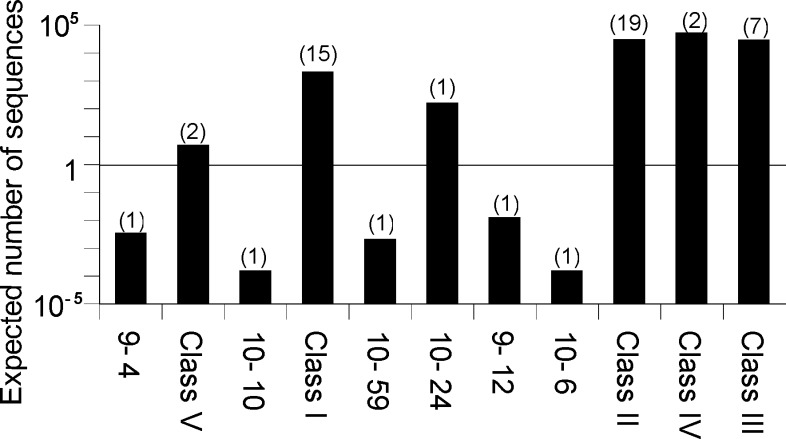
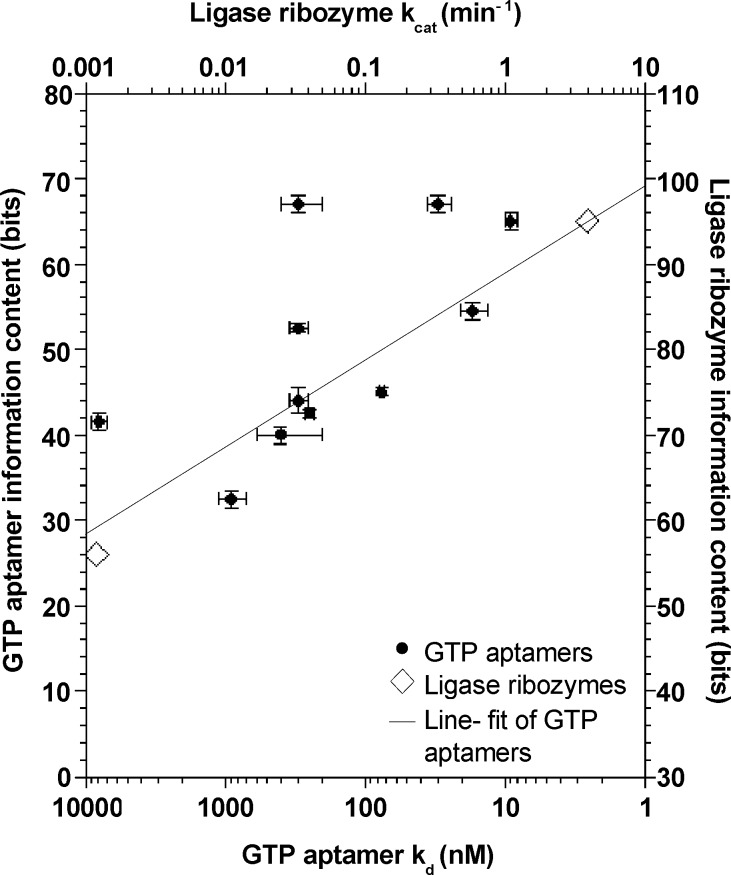
Very little is known about the distribution of functional DNA, RNA, and protein molecules in sequence space. The question of how the number and complexity of distinct solutions to a particular biochemical problem varies with activity is an important aspect of this general problem. Here we present a comparison of the structures and activities of eleven distinct GTP-binding RNAs (aptamers). By experimentally measuring the amount of information required to specify each optimal binding structure, we show that defining a structure capable of 10-fold tighter binding requires approximately 10 additional bits of information. This increase in information content is equivalent to specifying the identity of five additional nucleotide positions and corresponds to an approximately 1000-fold decrease in abundance in a sample of random sequences. We observe a similar relationship between structural complexity and activity in a comparison of two catalytic RNAs (ribozyme ligases), raising the possibility of a general relationship between the complexity of RNA structures and their functional activity. Describing how information varies with activity in other heteropolymers, both biological and synthetic, may lead to an objective means of comparing their functional properties. This approach could be useful in predicting the functional utility of novel heteropolymers.


Figures

Figure 1
Figure 1
Aptamer sequences and secondary structures. (A) aptamers with simple stem-loop structures, (B) aptamers with one internal bulge-loop, and (C) aptamers with two internal bulge-loops. The sequences shown have been optimized for GTP binding. Regions that showed W−C covariation are drawn as lines of plain text. The 5‘ end of each aptamer is at the top-left end of the structure. The information content of each position within the loops is color-coded as indicated.
Figure 2
Figure 2
Example of selected sequence variants. The Class I-aptamer template was mutagenized 21% per position to search for functional sequence variants and is shown at the top. The secondary-structure model is shown in bracket form on the second line. Mutations in the stem regions are color-coded as follows:  red, W−C covariation; orange, new W−C pairings; green, Wobble-pairings; black, broken base pairs. Mutations in the loop regions are marked in purple. The graph shows the information content calculated for each loop position; positions referred to in the text are shaded. Error bars show ± SD See Supporting Figure 1 for all eleven sets of selected alignments and Supporting Chart 1 for all original, minimized, and optimized sequences.
Figure 3
Figure 3
Good correspondence between binding affinity and the intricacy of aptamer secondary structures. The number of stems in each aptamer is plotted against logkd.
Figure 4
Figure 4
Expected number of aptamer sequences in original pool. The expected number of sequences corresponding to each aptamer structure in a pool similar to the one used in the original selection19 is shown on a log scale. The number of independent sequence isolations we actually observed are indicated in parentheses.
Figure 5
Figure 5
More complex structures required for more activity. GTP aptamer information content (method C) is plotted against logkd. Error bars show ± SD The line was generated by applying Kendall's robust line-fit method to the GTP aptamer data. Ligase ribozyme information content is plotted against log kcat (vertically shifted for clarity).

References

    1. Onuchic J. N.; Luthe-Schulten Z.; Wolynes P. G Theory of protein folding: the energy landscape perspective. Annu Rev Phys Chem. 1997, 48, 545–600. 10.1146/annurev.physchem.48.1.545. - DOI - PubMed
    1. Smith J. M Natural selection and the concept of a protein space. Nature 1970, 225, 563–564. 10.1038/225563a0. - DOI - PubMed
    1. Kauffman S. A.; Weinberger E. D The NK model of rugged fitness landscapes and its application to maturation of the immune response. J. Theor. Biol. 1989, 141, 211–245. 10.1016/S0022-5193(89)80019-0. - DOI - PubMed
    1. Lehman N.; Donne M. D.; West M.; Dewey T. G The genotypic landscape during in vitro evolution of a catalytic RNA: implications for phenotypic buffering. J. Mol. Evol. 2000, 50, 481–490. - PubMed
    1. Taverna D. M.; Goldstein R. A The distribution of structures in evolving protein populations. Biopolymers 2000, 53, 1–8. 10.1002/(SICI)1097-0282(200001)53:1%3C1::AID-BIP1%3E3.0.CO;2-X. - DOI - PubMed

Publication types