

P-type ATPase heavy metal transporters with roles in essential zinc homeostasis in Arabidopsis
- PMID: 15100400
- PMCID: PMC423219
- DOI: 10.1105/tpc.020487
P-type ATPase heavy metal transporters with roles in essential zinc homeostasis in Arabidopsis
Abstract
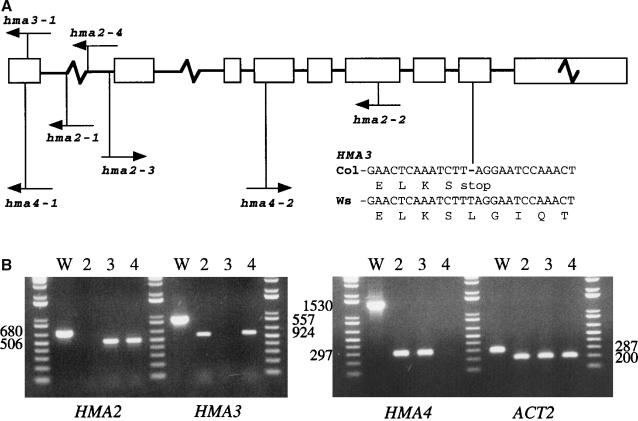
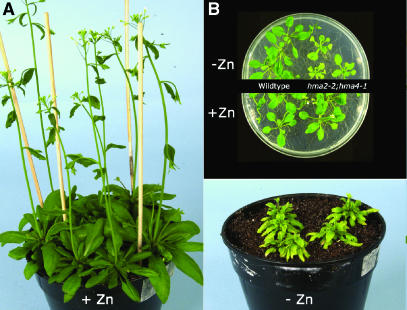
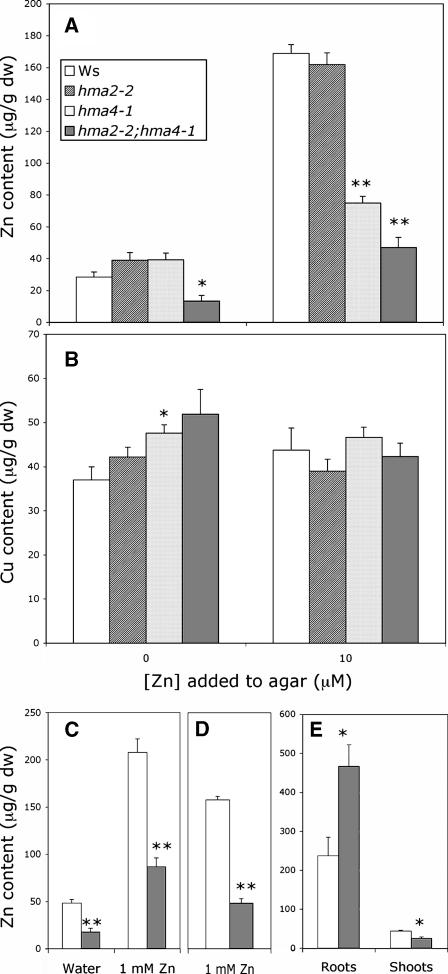
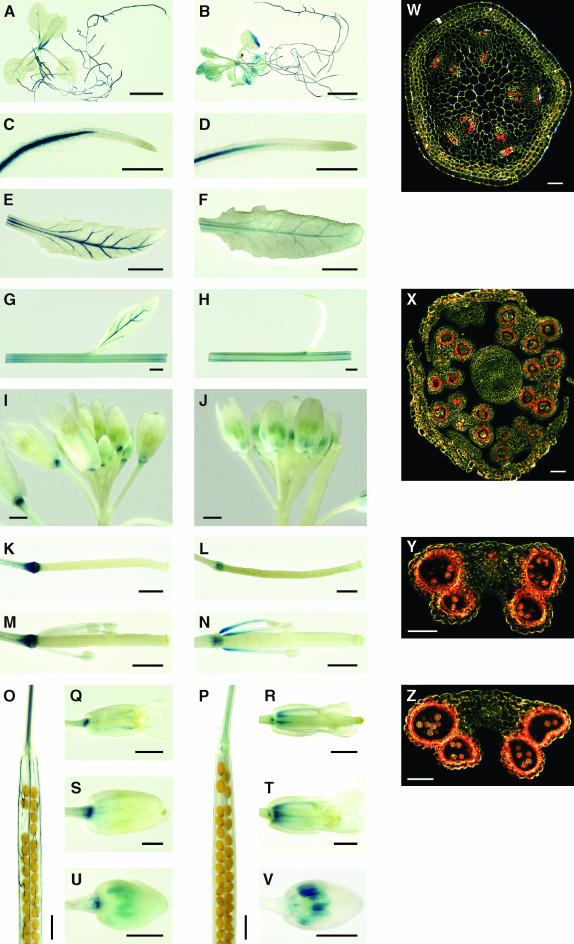
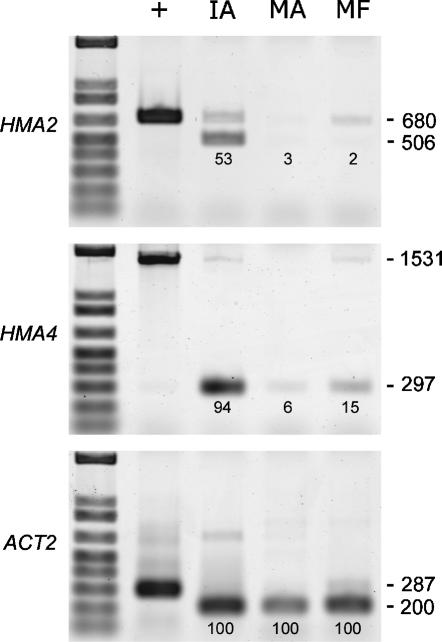
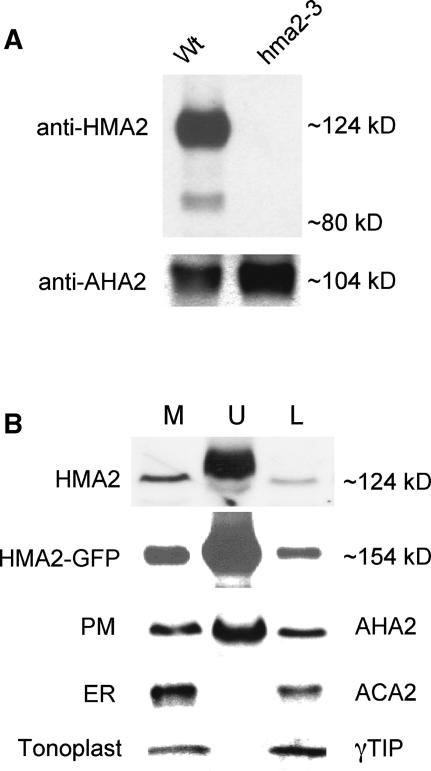
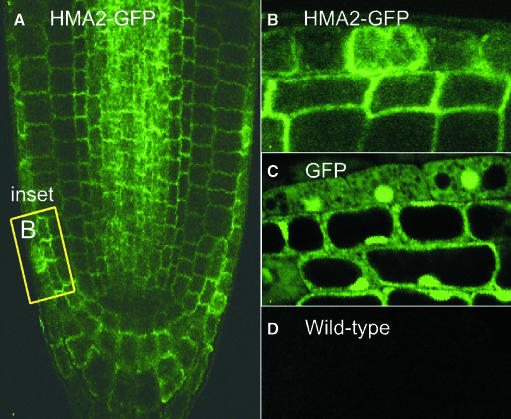
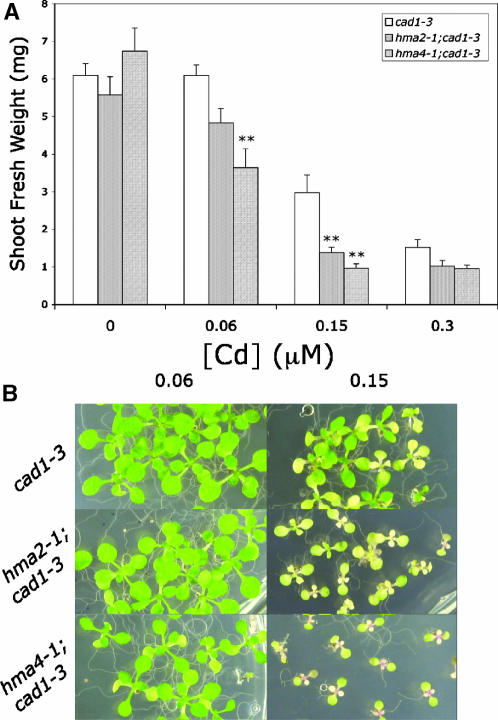
Arabidopsis thaliana has eight genes encoding members of the type 1(B) heavy metal-transporting subfamily of the P-type ATPases. Three of these transporters, HMA2, HMA3, and HMA4, are closely related to each other and are most similar in sequence to the divalent heavy metal cation transporters of prokaryotes. To determine the function of these transporters in metal homeostasis, we have identified and characterized mutants affected in each. Whereas the individual mutants exhibited no apparent phenotype, hma2 hma4 double mutants had a nutritional deficiency phenotype that could be compensated for by increasing the level of Zn, but not Cu or Co, in the growth medium. Levels of Zn, but not other essential elements, in the shoot tissues of a hma2 hma4 double mutant and, to a lesser extent, of a hma4 single mutant were decreased compared with the wild type. Together, these observations indicate a primary role for HMA2 and HMA4 in essential Zn homeostasis. HMA2promoter- and HMA4promoter-reporter gene constructs provide evidence that HMA2 and HMA4 expression is predominantly in the vascular tissues of roots, stems, and leaves. In addition, expression of the genes in developing anthers was confirmed by RT-PCR and was consistent with a male-sterile phenotype in the double mutant. HMA2 appears to be localized to the plasma membrane, as indicated by protein gel blot analysis of membrane fractions using isoform-specific antibodies and by the visualization of an HMA2-green fluorescent protein fusion by confocal microscopy. These observations are consistent with a role for HMA2 and HMA4 in Zn translocation. hma2 and hma4 mutations both conferred increased sensitivity to Cd in a phytochelatin-deficient mutant background, suggesting that they may also influence Cd detoxification.
Figures

Similar articles
-
HMA P-type ATPases are the major mechanism for root-to-shoot Cd translocation in Arabidopsis thaliana.New Phytol. 2009;181(1):71-78. doi: 10.1111/j.1469-8137.2008.02638.x. New Phytol. 2009. PMID: 19076718
-
Functional analysis of the heavy metal binding domains of the Zn/Cd-transporting ATPase, HMA2, in Arabidopsis thaliana.New Phytol. 2009;181(1):79-88. doi: 10.1111/j.1469-8137.2008.02637.x. New Phytol. 2009. PMID: 19076719
-
Arabidopsis thaliana Zn2+-efflux ATPases HMA2 and HMA4 are required for resistance to the necrotrophic fungus Plectosphaerella cucumerina BMM.J Exp Bot. 2022 Jan 5;73(1):339-350. doi: 10.1093/jxb/erab400. J Exp Bot. 2022. PMID: 34463334
-
Metal binding affinities of Arabidopsis zinc and copper transporters: selectivities match the relative, but not the absolute, affinities of their amino-terminal domains.Biochemistry. 2009 Dec 15;48(49):11640-54. doi: 10.1021/bi901573b. Biochemistry. 2009. PMID: 19883117
-
The zinc homeostasis network of land plants.Biochim Biophys Acta. 2012 Sep;1823(9):1553-67. doi: 10.1016/j.bbamcr.2012.05.016. Epub 2012 May 22. Biochim Biophys Acta. 2012. PMID: 22626733 Review.
Cited by
-
Genome-Wide Association Study of Zinc Toxicity Tolerance within a Rice Core Collection (Oryza sativa L.).Plants (Basel). 2022 Nov 16;11(22):3138. doi: 10.3390/plants11223138. Plants (Basel). 2022. PMID: 36432867 Free PMC article.
-
Vacuolar nicotianamine has critical and distinct roles under iron deficiency and for zinc sequestration in Arabidopsis.Plant Cell. 2012 Feb;24(2):724-37. doi: 10.1105/tpc.111.095042. Epub 2012 Feb 28. Plant Cell. 2012. PMID: 22374397 Free PMC article.
-
Variation in the BrHMA3 coding region controls natural variation in cadmium accumulation in Brassica rapa vegetables.J Exp Bot. 2019 Oct 24;70(20):5865-5878. doi: 10.1093/jxb/erz310. J Exp Bot. 2019. PMID: 31367770 Free PMC article.
-
Rice P1B-type heavy-metal ATPase, OsHMA9, is a metal efflux protein.Plant Physiol. 2007 Nov;145(3):831-42. doi: 10.1104/pp.107.102236. Epub 2007 Sep 7. Plant Physiol. 2007. PMID: 17827266 Free PMC article.
-
Prioritizing strategies for wheat biofortification: Inspiration from underutilized species.Heliyon. 2023 Sep 17;9(10):e20208. doi: 10.1016/j.heliyon.2023.e20208. eCollection 2023 Oct. Heliyon. 2023. PMID: 37818015 Free PMC article. Review.
References
-
- Alonso, J.M., et al. (2003). Genome-wide insertional mutagenesis of Arabidopsis thaliana. Science 301, 653–657. - PubMed
-
- Assuncao, A.G.L., Schat, H., and Aarts, M.G.M. (2003). Thlaspi caerulescens, an attractive model species to study heavy metal hyperaccumulation in plants. New Phytol. 159, 351–360. - PubMed
-
- Axelsen, K.B., and Palmgren, M.G. (1998). Evolution of substrate specificities in the P-type ATPase superfamily. J. Mol. Evol. 46, 8–101. - PubMed
-
- Baker, A.J.M., and Whiting, S.N. (2002). In search of the Holy Grail—A further step in understanding metal hyperaccumulation? New Phytol. 155, 1–4. - PubMed
Publication types
MeSH terms
Substances
Associated data
- Actions
- Actions
- Actions
- Actions
LinkOut - more resources
Full Text Sources
Other Literature Sources
Molecular Biology Databases
