. 2004 May;10(5):828-40.
doi: 10.1261/rna.5196404.

Comparative analysis detects dependencies among the 5' splice-site positions

Affiliations

Comparative analysis detects dependencies among the 5' splice-site positions

Ido Carmel et al. RNA. 2004 May.

Abstract

Human-mouse comparative genomics is an informative tool to assess sequence functionality as inferred from its conservation level. We used this approach to examine dependency among different positions of the 5' splice site. We compiled a data set of 50,493 homologous human-mouse internal exons and analyzed the frequency of changes among different positions of homologous human-mouse 5' splice-site pairs. We found mutual relationships between positions +4 and +5, +5 and +6, -2 and +5, and -1 and +5. We also demonstrated the association between the exonic and the intronic positions of the 5' splice site, in which a stronger interaction of U1 snRNA and the intronic portion of the 5' splice site compensates for weak interaction of U1 snRNA and the exonic portion of the 5' splice site, and vice versa. By using an ex vivo system that mimics the effect of mutation in the 5' splice site leading to familial dysautonomia, we demonstrated that U1 snRNA base-pairing with positions +6 and -1 is the only functional requirement for mRNA splicing of this 5' splice site. Our findings indicate the importance of U1 snRNA base-pairing to the exonic portion of the 5' splice site.


Figures

FIGURE 1.
FIGURE 1.
Potential base pairs of U1 snRNA and 5′ ss in human and yeast (S. cerevisiae). We used 49,778 human U2-dependent 5′ ss sequences with the canonical GT nucleotides in the invariant positions taken from the homologous human–mouse exon database compiled by us (see text) and 253 yeast 5′ ss sequences from the Yeast Intron Database (YIDB; Lopez and Seraphin 2000). The 5′ ss consensus sequences of human and yeast are represented graphically (Burge http://genes.mit.edu/pictogram.html; upper part and lower part, respectively). Potential base pairs with the appropriate nucleotide of U1 snRNA are marked either by a vertical bar for highly frequent base pairs (>0.7) or by a colon for less abundant ones (<0.7). The consensus sequence of the constitutive and alternative 5′ ss subsets in human was not significantly different.
FIGURE 2.
FIGURE 2.
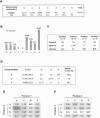
Comparative analysis of human–mouse homologous 5′ ss. (A) A data set of 45,519 homologous human–mouse U2-dependent 5′ ss sequences with GT at the invariant positions of introns for which their upstream exon is constitutively spliced and for which they share the same reading frame was sorted by the number of different bases between each homologous 5′ ss sequence. The size and percentage (in parentheses) of either set are shown. (B) The distribution by positions of the 5′ ss homologous sequences that contain one base difference of the 5′ ss pairs. The percentage and the position are indicated above and below each column, respectively. (C) Assuming independence of a single substitution event, we calculated the expected number of human–mouse homologous 5′ ss sequences with two base differences at each two positions of the 5′ ss (see text). The expectation was then compared with the observed numbers. A considerable gap between our expectation and the observed values was found at positions +4 and +5, positions +5 and +6, positions −1 and +5, and at positions −2 and +5. The exact values regarding these positions are shown. Detailed analysis is described in Figure 1S in the supplementary materials (http://www.tau.ac.il/~gilast/sup_mat.htm). (D) The 5′ ss pairs were sorted into three groups, according to their reading frame, and the same analysis demonstrated in panel B was performed on each of the groups. The size and the percentage of each group are indicated in the column titled by N(%). Detailed frequency of the exonic positions and the frequency of substitution events in the intronic positions are shown. The percentage of changes in positions −1 to −3 is shown when an asterisk marks the wobble position in each frame. (E,F) The variability degree (see text) of base combinations at positions +4 and +5 (E) and at positions +5 and +6 (F). Bold numbers correspond with the consensual base combination. The intensity of the gray level in the background of each value corresponds with the degree of variability.
FIGURE 3.
FIGURE 3.
A linkage between the exonic and intronic sequences of the 5′ ss. The values of free energy (ΔG) created by base-pairing of U1 snRNA with either the exonic portion (positions −3 to +2) or the intronic portion (positions +1 to +6) of the 5′ ss were predicted. All the analyzed 5′ ss sequences to “fasten” the exonic 5′ ss base-pairing to U1 snRNA in the right alignment (base-pairing with positions 11 to 7 of U1 snRNA), and also to include the stacking energy of positions +1 and −1 in the prediction. All of the 5′ ss contain GT; thus, by definition, the additional predicted energetic contribution of the base-pairing of positions +1 and +2 is constant. (A) The 5′ ss sequences were sorted into four groups of similar sizes, which define scopes of the predicted free-energy values of base-pairing of U1 snRNA and the exonic and intronic portions of the 5′ ss. The size (#5′ ss) and percentage of each subset is shown. (B) The average predicted ΔG value created by base-pairing of U1 snRNA and positions +1 to +6 of the 5′ ss (U1snRNA:intronic 5′ ss ΔG) was examined, with respect to the scopes of ΔG created by base-pairing of U1 snRNA and positions −3 to +2 of the 5′ ss (U1 snRNA:exonic 5′ ss ΔG). The exact values are indicated below each column; the error bars are shown as ±1 standard error. (C) Similar to panel B, but in the inverse direction, the predicted ΔG from base-pairing of U1 snRNA to positions −3 to +2 of the 5′ ss (U1 snRNA:exonic 5′ ss ΔG), with respect to the ΔG created by base-pairing of U1 snRNA and positions +1 to +6 of the 5′ ss (U1 snRNA:intronic 5′ ss ΔG).
FIGURE 4.
FIGURE 4.
Analysis of the 5′ ss according to the potential number of base pairs with U1 snRNA. (A) 45,519 human 5′ ss sequences from constitutive exons were sorted into sets, according to the total number of base pairs with U1 snRNA (includes G:U). The number of motifs in each set is indicated above each point. (B) The consensus sequences of each set are represented graphically (Burgehttp://genes.mit.edu/pictogram.html). The number of base pairs with U1 snRNA and the size of each set are indicated on the left of each diagram. The same analysis that takes into account only Watson–Crick base pairs is demonstrated in Figure 4S in the Supplementary Materials (see http://www.tau.ac.il/~gilast/sup_mat.htm).
FIGURE 5.
FIGURE 5.
The importance of U1 base-pairing with positions −1 and +6 of the 5′ ss. The indicated plasmids were introduced into 293T cells by transfection, total cytoplasmic RNA was extracted, and splicing products were separated in 2% agarose gel after reverse transcriptase polymerase chain reaction (RT-PCR). (Lower part) A schematic drawing of U1 and U6 snRNA potential base-pairing with the 5′ ss of exon 20 of IKBKAP gene is shown; a base pair is marked by a colon. The positions of the 5′ ss, U1, and U6 snRNA are marked above and underneath, respectively. The U-to-C mutation in position +6, leading to FD, is shown by an arrow. (Upper part, lanes 13) Splicing products of IKBKAP mini-gene (wt); lane 1 wt only; lanes 2,3, cotransfection with U1 mini-gene containing mutation of C to T at position 9. It is important to state that exogenous and endogenous U1 compete for 5′ ss selection (Zhuang and Weiner 1986). (Lanes 46) Splicing products of FD mini-gene, which is the IKBKAP mini-gene containing mutation of IVS20(+6T → C); lane 4, FD mutant only, lanes 5,6 cotransfection with U1(9C → T). (Lane 7) IKBKAP mini-gene with A-to-G mutation in the last nucleotide of exon 20. (Lane 8) FD mini-gene with A-to-G mutation in the last nucleotide of exon 20. (Lane 9) Similar to lanes 5,6. (Lane 10) similar to lane 9, except that the U1 cotransfected gene contains a C-to-A mutation in position 9. (Lanes 1113) FD mini-gene; lane 11, FD mini-gene alone; lane 12, cotransfection with U1 gene containing mutation of A to G in position 3; lane 13, cotransfection with U6 gene containing mutation of A to G in position 41. In lanes 5,6,9 and, to some extent, also in lane 12, the upper RT-PCR product contains two closely joined bands (20 nt difference). Their sequence was found to be identical (from one end of the PCR products to the other) to the joint of exons 19–20–21 (no alternative selection of 5′ or 3′ ss; see also Fig. 5S in Supplementary Materials, at http://www.tau.ac.il/~gilast/sup_mat.htm). Compensatory mutations in three different positions of the 5′ end of U1 revealed the same phenomena, and it was detected in two different mini-genes (IKBKAP and ADAR2). re-PCR of the upper band of this doublet led it to migrate in a similar position to that of the wt products in an agarose gel. We have no interpretation for this separation pattern. The procedures of these experiments are identical to those described by Lev-Maor et al. (2003).

Similar articles

Cited by

References

    1. Aebi, M., Hornig, H., and Weissmann, C. 1987. 5′ cleavage site in eukaryotic pre-mRNA splicing is determined by the overall 5′ splice region, not by the conserved 5′ GU. Cell 50: 237–246. - PubMed
    1. Altschul, S.F., Madden, T.L., Schaffer, A.A., Zhang, J., Zhang, Z., Miller, W., and Lipman, D.J. 1997. Gapped BLAST and PSI-BLAST: A new generation of protein database search programs. Nucleic Acids Res. 25: 3389–3402. - PMC - PubMed
    1. Alvarez, C.J. and Wise, J.A. 2001. Activation of a cryptic 5′ splice site by U1 snRNA. RNA 7: 342–350. - PMC - PubMed
    1. Barrass, J.D. and Beggs, J.D. 2003. Splicing goes global. Trends Genet. 19: 295–298. - PubMed
    1. Brow, D.A. 2002. Allosteric cascade of spliceosome activation. Annu. Rev. Genet. 36: 333–360. - PubMed

Publication types

LinkOut - more resources