

Nucleic acid amplification tests in the diagnosis of tuberculous pleuritis: a systematic review and meta-analysis
- PMID: 15102325
- PMCID: PMC387423
- DOI: 10.1186/1471-2334-4-6
Nucleic acid amplification tests in the diagnosis of tuberculous pleuritis: a systematic review and meta-analysis
Abstract
Background: Conventional tests for tuberculous pleuritis have several limitations. A variety of new, rapid tests such as nucleic acid amplification tests--including polymerase chain reaction--have been evaluated in recent times. We conducted a systematic review to determine the accuracy of nucleic acid amplification (NAA) tests in the diagnosis of tuberculous pleuritis.
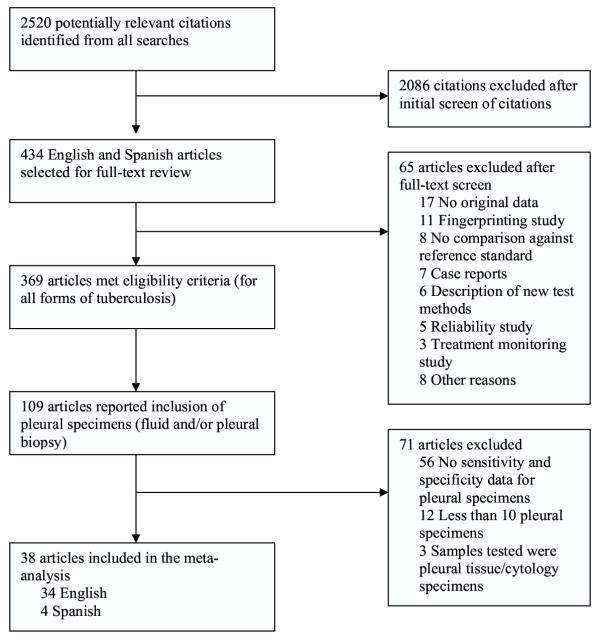
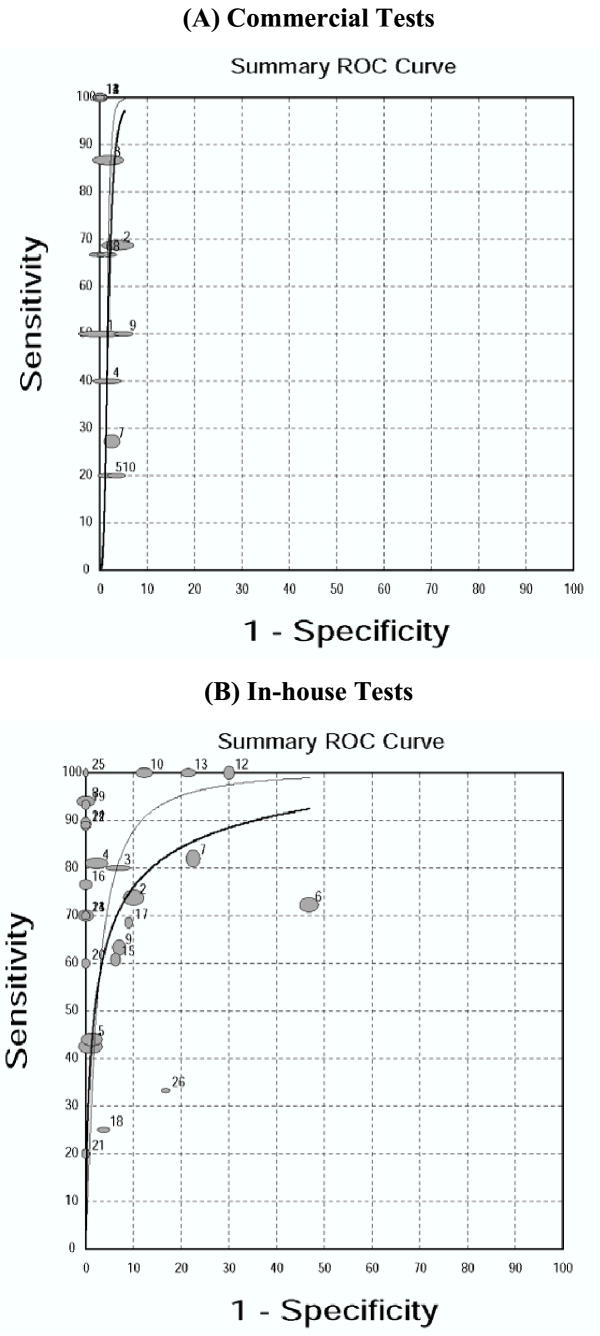
Methods: A systematic review and meta-analysis of 38 English and Spanish articles (with 40 studies), identified via searches of six electronic databases, hand searching of selected journals, and contact with authors, experts, and test manufacturers. Sensitivity, specificity, and other measures of accuracy were pooled using random effects models. Summary receiver operating characteristic curves were used to summarize overall test performance. Heterogeneity in study results was formally explored using subgroup analyses.
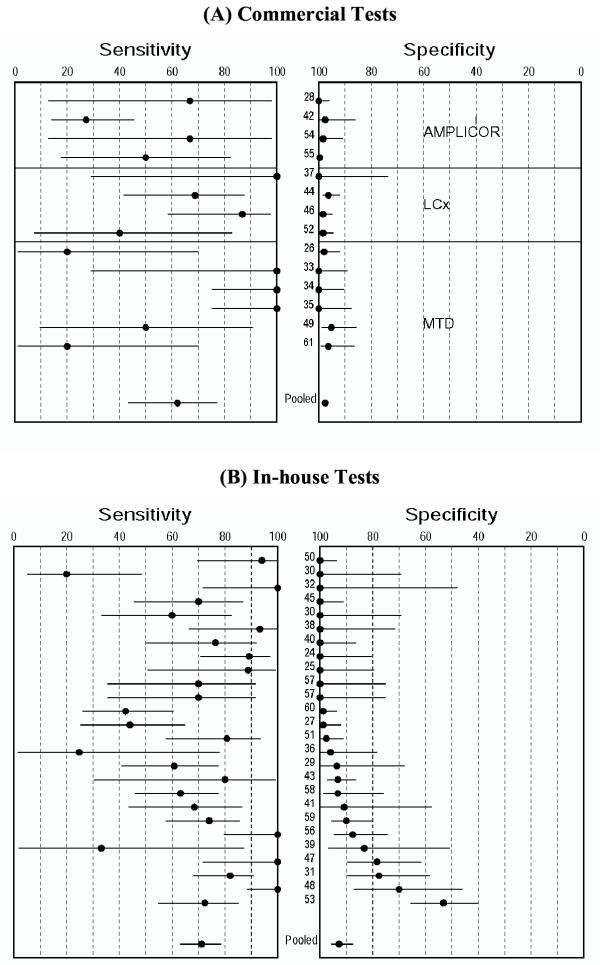
Results: Of the 40 studies included, 26 used in-house ("home-brew") tests, and 14 used commercial tests. Commercial tests had a low overall sensitivity (0.62; 95% confidence interval [CI] 0.43, 0.77), and high specificity (0.98; 95% CI 0.96, 0.98). The positive and negative likelihood ratios for commercial tests were 25.4 (95% CI 16.2, 40.0) and 0.40 (95% CI 0.24, 0.67), respectively. All commercial tests had consistently high specificity estimates; the sensitivity estimates, however, were heterogeneous across studies. With the in-house tests, both sensitivity and specificity estimates were significantly heterogeneous. Clinically meaningful summary estimates could not be determined for in-house tests.
Conclusions: Our results suggest that commercial NAA tests may have a potential role in confirming (ruling in) tuberculous pleuritis. However, these tests have low and variable sensitivity and, therefore, may not be useful in excluding (ruling out) the disease. NAA test results, therefore, cannot replace conventional tests; they need to be interpreted in parallel with clinical findings and results of conventional tests. The accuracy of in-house nucleic acid amplification tests is poorly defined because of heterogeneity in study results. The clinical applicability of in-house NAA tests remains unclear.
Figures
References
-
- Markowitz N, Hansen NI, Hopewell PC, Glassroth J, Kvale PA, Mangura BT, Wilcosky TC, Wallace JM, Rosen MJ, Reichman LB. Incidence of tuberculosis in the United States among HIV-infected persons. The Pulmonary Complications of HIV Infection Study Group. Ann Intern Med. 1997;126:123–132. - PubMed
-
- Centers for Disease Control and Prevention Reported Tuberculosis in the United States, 2001. Atlanta. 2001. http://www.cdc.gov/nchstp/tb/surv/surv2001/default.htm
-
- Light RW. Pleural Diseases. Philadelphia: Lippincott Williams & Wilkins; 2001.
-
- Valdes L, Alvarez D, Valle JM, Pose A, San Jose E. The etiology of pleural effusions in an area with high incidence of tuberculosis. Chest. 1996;109:158–162. - PubMed
Publication types
MeSH terms
Substances
Grants and funding
LinkOut - more resources
Full Text Sources
Other Literature Sources
