Review
. 2004 Feb;14(1):10-20.
doi: 10.1016/j.sbi.2004.01.012.

Catabolite activator protein: DNA binding and transcription activation

Affiliations
Review

Catabolite activator protein: DNA binding and transcription activation

Catherine L Lawson et al. Curr Opin Struct Biol. 2004 Feb.

Abstract

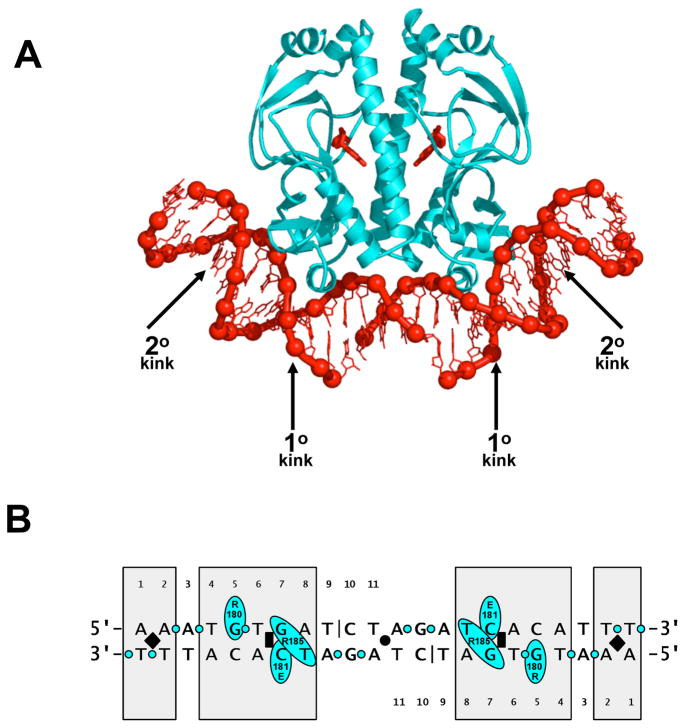
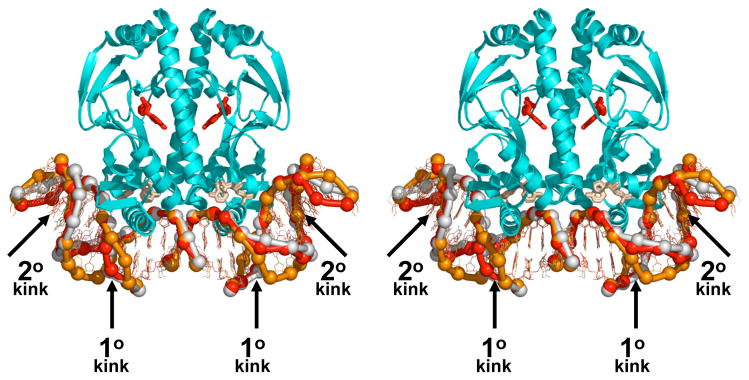
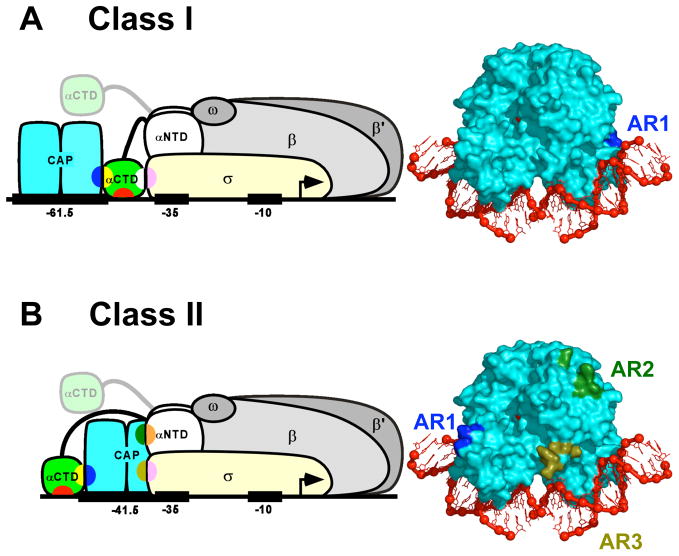
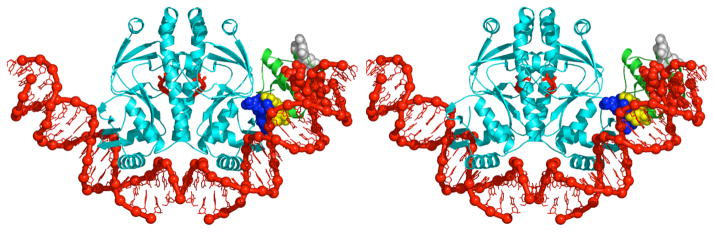
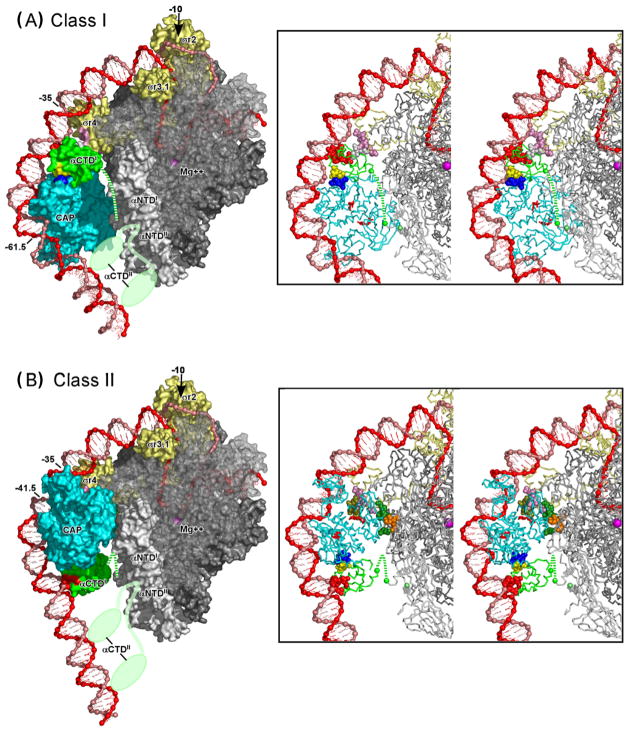
Recently determined structures of the Escherichia coli catabolite activator protein (CAP) in complex with DNA, and in complex with the RNA polymerase alpha subunit C-terminal domain (alphaCTD) and DNA, have yielded insights into how CAP binds DNA and activates transcription. Comparison of multiple structures of CAP-DNA complexes has revealed the contributions of direct and indirect readout to DNA binding by CAP. The structure of the CAP-alphaCTD-DNA complex has provided the first structural description of interactions between a transcription activator and its functional target within the general transcription machinery. Using the structure of the CAP-alphaCTD-DNA complex, the structure of an RNA polymerase-DNA complex, and restraints from biophysical, biochemical and genetic experiments, it has been possible to construct detailed three-dimensional models of intact class I and class II transcription activation complexes.


Figures

Figure 1
Figure 1
DNA binding by CAP: structure of the CAP-DNA complex. (A) Structure of CAP in complex with its consensus DNA site (PDB 1RUN) [14], showing primary- and secondary-kink sites. CAP is in cyan; DNA and cAMP bound to CAP are in red. The crystallization DNA fragment contained a single-phosphate gap between positions 9 and 10 of each DNA half-site (Fig 1b). (B) Summary of CAP-DNA interactions. Shaded boxes indicate positions at which CAP exhibits strong sequence preferences [11,15,16,17]. The black circle, black rectangles, and black diamonds indicate, respectively, the two fold-symmetry axis, the primary-kink sites; and the secondary-kink sites. The black vertical lines indicate the positions of single-phosphate gaps present in the crystallization DNA fragment. The cyan ovals and cyan circles indicate, respectively, amino acid-base contacts and amino acid-phosphate contacts.
Figure 2
Figure 2
DNA binding by CAP: structures of CAP-DNA complexes with substitutions in the primary-kink site. Superimposed structures of CAP in complex with the consensus DNA site (DNA in red; PDB 1O3Q [23*]), CAP in complex with DNA having C:G in place of T:A at position 6 of each DNA half-site (DNA in yellow; PDB 1O3R [23*]), and [Asp181]CAP in complex with DNA having C:G in place of T:A at position 6 of each DNA half-site (DNA in orange; PDB 1O3S [22*]). The structures were obtained from isomorphous crystals with space-group symmetry P3121. Structures of CAP-DNA complexes with this space-group symmetry exhibit two molecules of cAMP per CAP subunit: one in the high-affinity site for cAMP (red), and one in the low-affinity site for cAMP (beige) [22*,23*,24].
Figure 3
Figure 3
Transcription activation by CAP: schematic models and activating regions. (A) Transcription activation at a Class I CAP-dependent promoter [1,40**]. Left: Ternary complex of CAP, RNAP, and a Class I CAP-dependent promoter having the DNA site for CAP centered at position -61.5 [e.g., lac or CC(-61.5)]. Transcription activation involves interaction between AR1 of the downstream subunit of CAP (blue) and the “287 determinant” of one αCTD protomer (yellow). The AR1-αCTD interaction facilitates binding of αCTD, through its “265 determinant” (red), to the DNA segment immediately downstream of CAP and, through its “261 determinant” (white), to residues 573–604 within σR4 (pink). The second αCTD protomer (positioned arbitrarily in figure) interacts non-specifically with upstream DNA [1,39,41]. Right: Structure of the CAP-DNA complex showing AR1 of the downstream subunit (blue). (B) Transcription activation at a Class II CAP-dependent promoter [1,58,59]. Left: Ternary complex of CAP, RNAP, and a Class II CAP-dependent promoter having the DNA site for CAP centered at position −41.5 [e.g., gal or CC(−41.5)]. Transcription activation involves three sets of CAP-RNAP interactions: (i) interaction between AR1 of the upstream subunit of CAP (blue) and the “287 determinant” of one αCTD (yellow), an interaction that facilitates binding of αCTD, through its “265 determinant” (red), to the DNA segment immediately upstream of CAP; (ii) interaction between AR2 of the downstream subunit of CAP (dark green) and residues 162–165 of αNTDI (orange); and (iii) interaction between AR3 of the downstream subunit of CAP (olive green) and residues 593–603 of σR4 (pink). The second αCTD protomer (positioned arbitrarily in figure) interacts non-specifically with upstream DNA [1,62,63]. Right: Structure of the CAP-DNA complex showing AR1 of the upstream subunit (blue), AR2 of downstream subunit (dark green), and AR3 of downstream subunit (olive green).
Figure 4
Figure 4
Transcription activation by CAP: structure of the CAP-αCTD-DNA complex. CAP-αCTD-DNA interactions representative of those at Class I and Class II CAP-dependent promoters (PDB 1LB2 [44**]). CAP is in cyan; αCTD is in green; DNA and cAMP bound to CAP are in red. AR1 of CAP (blue), the “287 determinant” of αCTD (yellow), the “265 determinant” of αCTD (red), and the “261 determinant” of αCTD (white) are in van der Waals representations.
Figure 5
Figure 5
Transcription activation by CAP: structural models of intact Class I and Class II CAP-RNAP-promoter complexes. (A) Structural model of the intact Class I CAP-RNAP-promoter complex at lac. (B) Structural model of the intact Class I CAP-RNAP-promoter complex at CC(−41.5). In each panel, a molecular surface representation is shown at left; and a stereodiagram with a ribbon representation is shown at right. Colors of CAP and RNAP are as in Fig 3: CAP is in cyan; αCTDI is in green; αCTDII is in light green (shown in two alternative positions in surface representations; omitted for clarity in ribbon representations); σ70 is in light yellow; αNTDI and αNTDII are in light gray; β is in medium gray (semi-transparent in surface representations, to permit view of DNA strands in RNAP active-center cleft); and β’ and ω are in dark gray. Colors of determinants of CAP and RNAP also are as in Fig 3: AR1, AR2, and AR3 of CAP are in dark blue, dark green, and olive green; the 287, 265, and 261 determinants of αCTDI are in yellow, red, and white; the 162–165 determinant of αNTDI is in orange; and the 593–604 determinant of σ70 is in pink. The DNA template and nontemplate strands are in red and pink. The C-terminus of αNTDI (green) the C-terminus of αNTDII (light green), and the active-center Mg++ (magenta) are indicated by spheres. The linker connecting αCTDI and αNTDI is indicated by a dashed green line. The linker connecting αCTDII and αNTDII is indicated in each of two alternative positions as a light green line. Methods: Models were constructed by: (i) joining crystal structures of the CAP-αCTD-DNA complex (PDB 1LB2 [44**]), the σR4-(−35 element) complex (PDB 1KU7 [47**]), and an RNAP-DNA complex (PFB 1L9Z [49**]; residues 150–160 and 164–170 of αNTDI modelled as in PDB 1BDF [65]; residues 161–163 of αNTDII modelled along shortest sterically allowed path; side chains modelled using MaxSprout [http://www.ebi.ac.uk/maxsprout/] )--superimposing DNA segments of the three structures onto a single, continuous DNA segment having sites spaced as at lac (panel A) or CC(−41.5) (panel B); (ii) deforming conformations of DNA positions −13 to −31 and −41 to −36 (panel A) or −13 to −30 and −38 to 33 (panel B) to minimize the elastic energy of DNA at the base-pair level [50] while satisfying DNA anchoring conditions, non-interpenetration constraints (Cα-Cα distance ≥3.5 Å for all residue pairs), and proximity constraints (Cα-Cα distance ≤12 Å for residue pairs specified below); and (iii) modelling DNA template-strand positions −11 to +20 and nontemplate-strand positions −7 to +20 as in published models of the RNAP-promoter open complex [39,51**]. For panel A, the following proximity constraints were used: proximity of residues 257, 258, 259, and 261of αCTD to at least one of residues 593, 596, 597, 600, 601, and 604 of σR4, and vice versa (mutational analysis [36,37,40**]); and proximity of residue 261of αCTD to residues 596 and 600 of sR4 (suppression analysis [40**]) (residues numbered as in E. coli RNAP). For panel B, the following proximity constraints were used: proximity of residues 19, 21, 96, and 101 of the downstream CAP subunit to at least one of residues 162, 163, 164, and 165 of αNTDI, and vice versa (mutational analysis [56]); proximity of residues 52, 53, 54, 55, and 58 of the downstream CAP subunit to at least one of residues 593, 596, 597, 599, and 603 of σR4 and vice versa (mutational analysis [58,60]); and proximity of residue 58 of the downstream CAP subunit to residue 596 of σR4 (suppression analysis [59]) (residues numbered as in E. coli RNAP). The models have been deposited in the PDB (PDB **** and ****). Figures were prepared using PyMol [http://www.pymol.org]. The view orientation reflects rotation by −45 on the y-axis relative to the “upstream” view orientation in published models of the RNAP-promoter open complex [39,51**]).

References

    1. Busby S, Ebright RH. Transcription activation by catabolite activator protein (CAP) J Mol Biol. 1999;293:199–213. - PubMed
    1. Rhodius VA, Busby SJ. Positive activation of gene expression. Curr Opin Microbiol. 1998;1:152–159. - PubMed
    1. Woychik NA, Hampsey M. The RNA polymerase II machinery: structure illuminates function. Cell. 2002;108:453–463. - PubMed
    1. Passner JM, Schultz SC, Steitz TA. Modeling the cAMP-induced allosteric transition using the crystal structure of CAP-cAMP at 2.1 A resolution. J Mol Biol. 2000;304:847–859. - PubMed
    1. Chu SY, Tordova M, Gilliland GL, Gorshkova I, Shi Y, Wang S, Schwarz FP. The structure of the T127L/S128A mutant of cAMP receptor protein facilitates promoter site binding. J Biol Chem. 2001;276:11230–11236. - PubMed

Publication types

MeSH terms

LinkOut - more resources